Portland Suburbs by the Numbers 2021
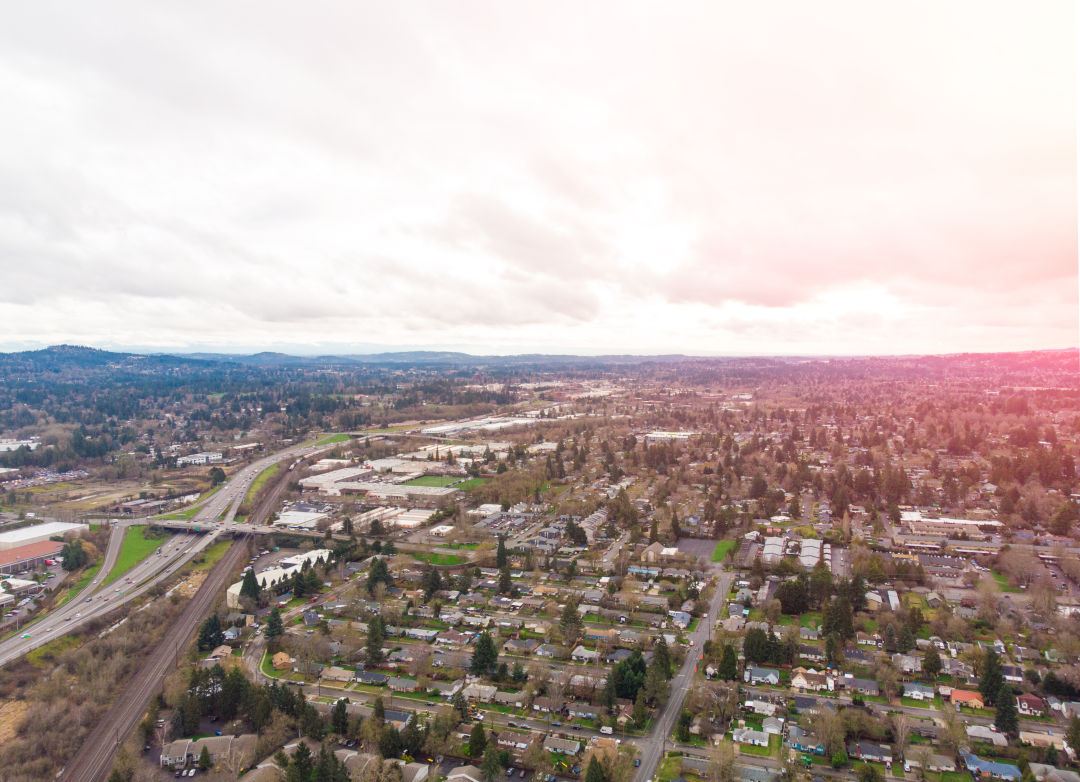
An aerial shot of Beaverton, Oregon.
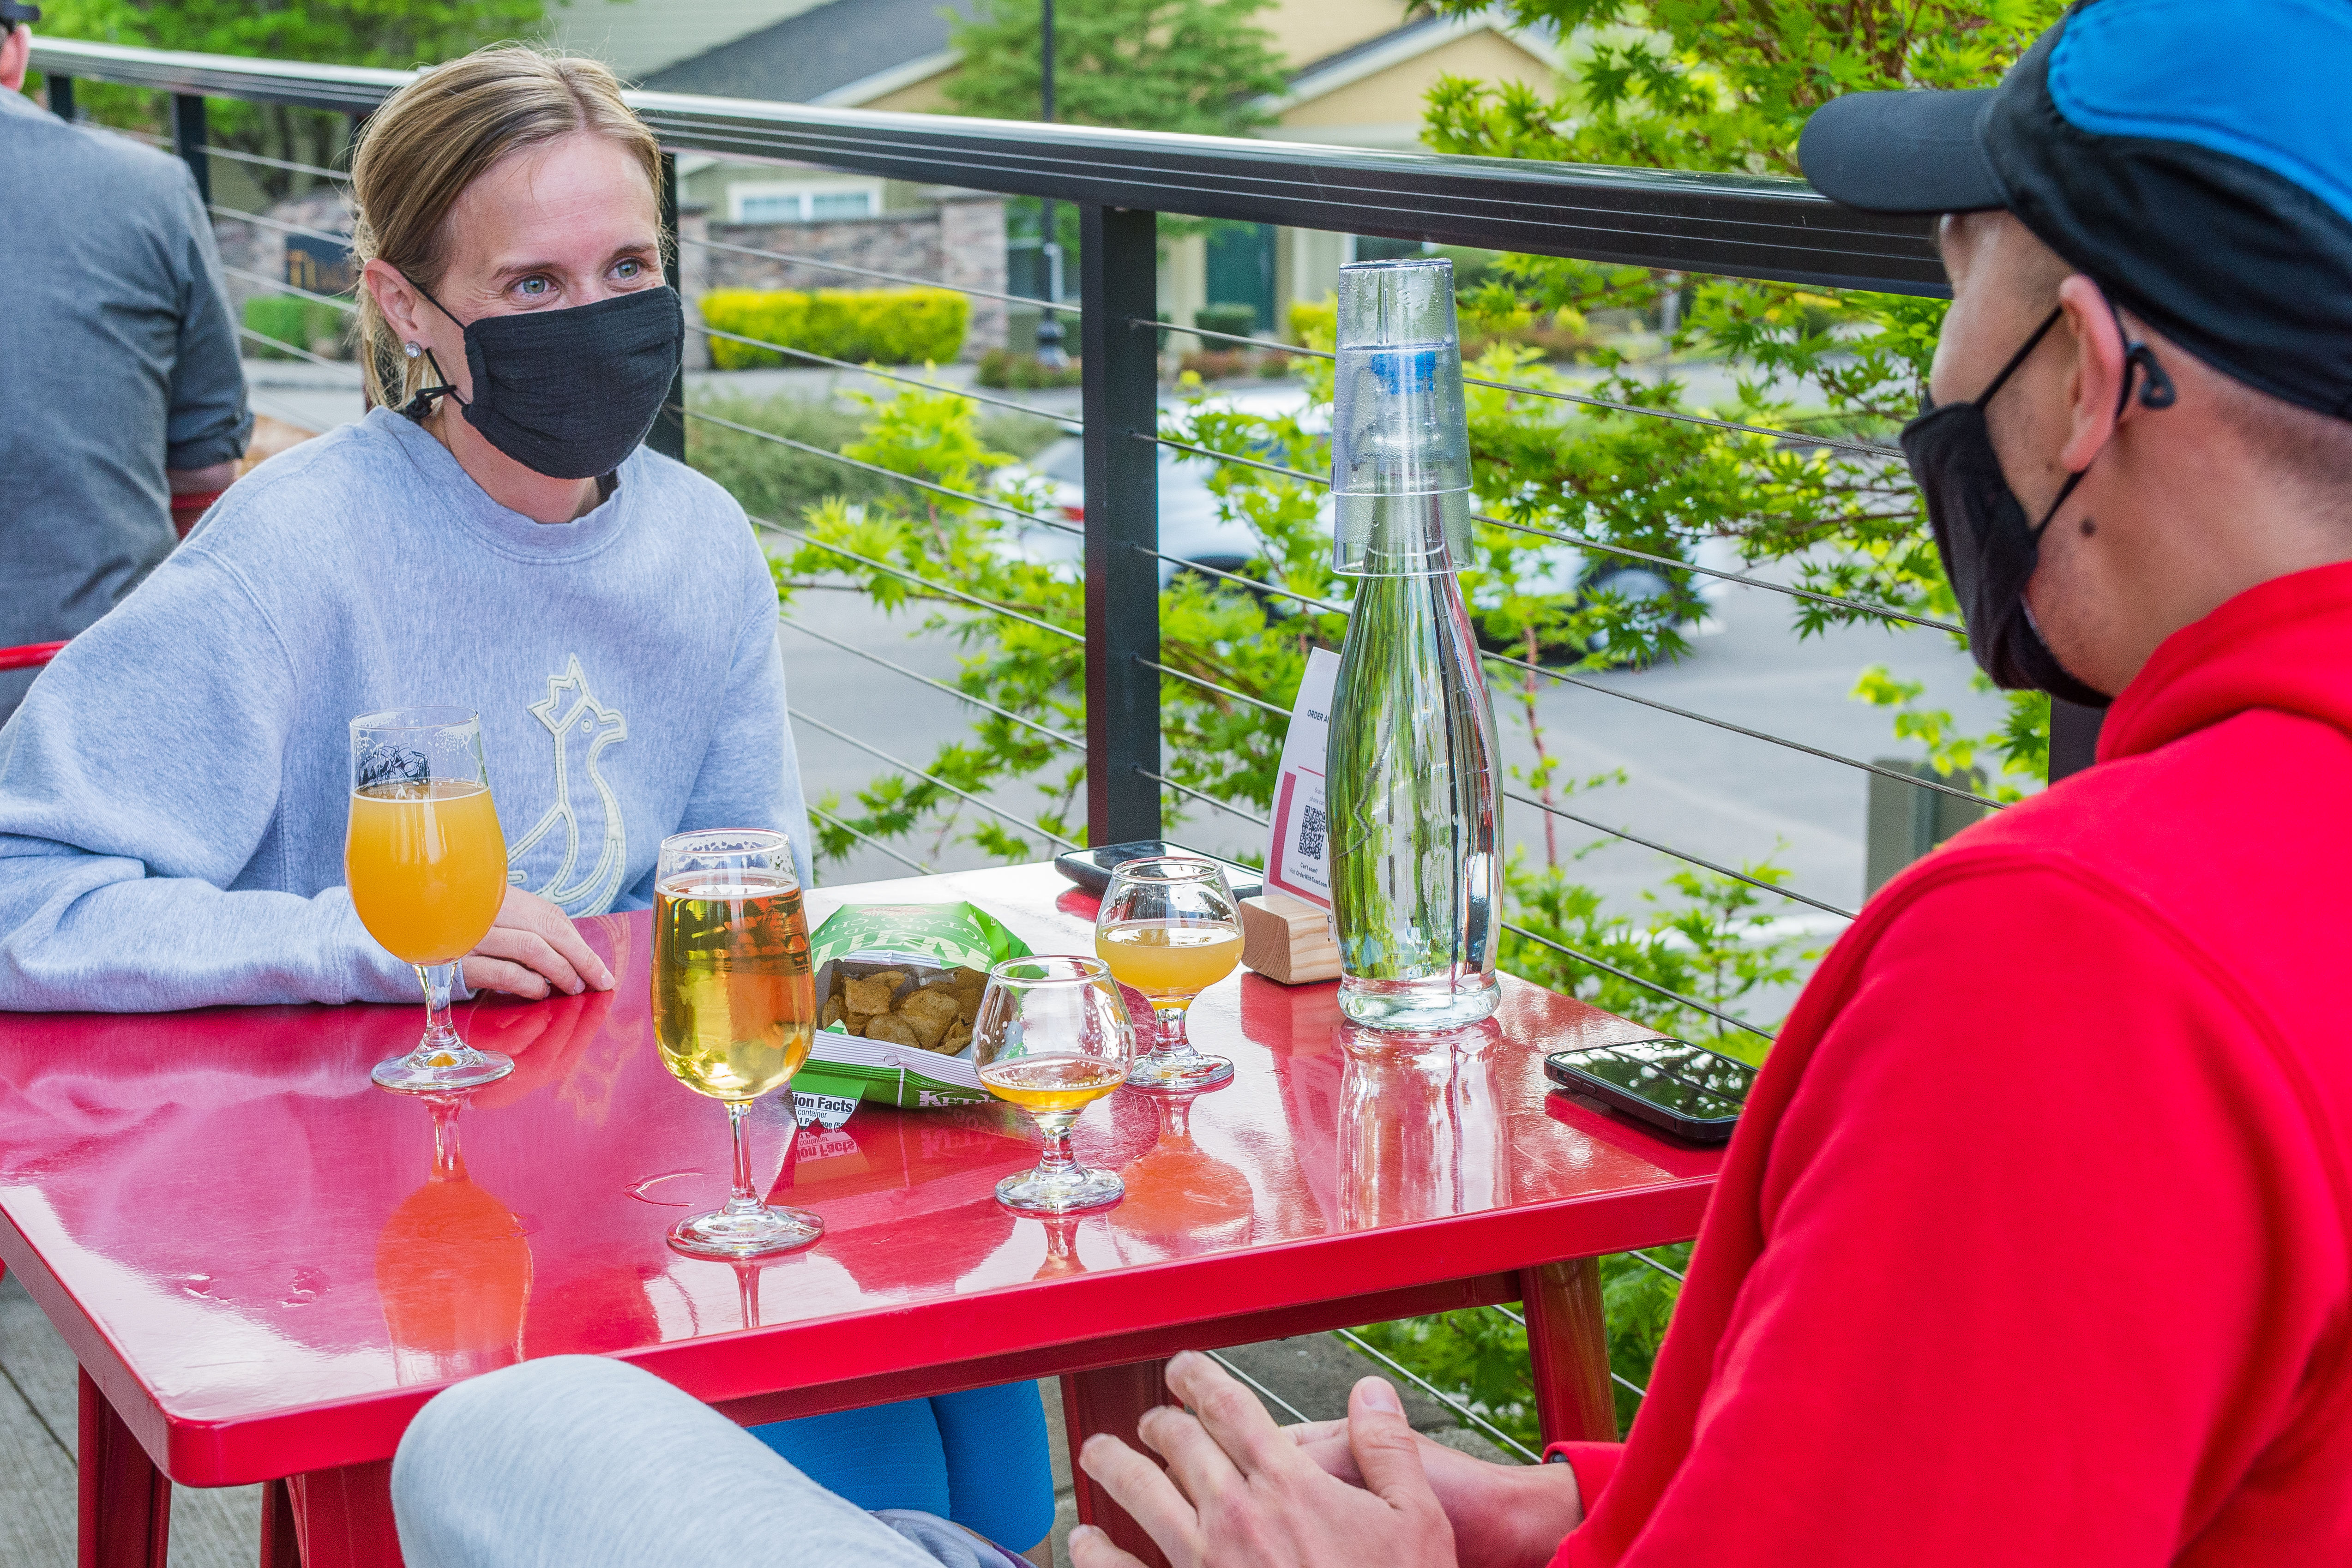
In case you haven't heard, the suburbs around here are booming, in a big way. (And we're not just talking about the beer there.) Everywhere save for Wood Village saw median price jumps between 2019 and 2020. Growth has been especially pronounced in roomy, outer-ring commuter neighborhoods including Sherwood, Estacada, and Washougal, Washington. Those with deep pockets seem to flock to Lake Oswego and West Linn, two of our highest-priced suburban markets; those on more shoestring budgets should look at Wood Village, Fairview, and St. Helens.
| CITY* (Demographic info for starred cities is for 2020; others are five-year estimates) | Median 2020 home sale price ($) | Average Sale Price ($) | Average cost per square foot ($) | Days on market (avg.) | Homes sold in 2020 (#) | Total Condo Sales | Share of 2020 sales that were condos (%) | 1-year median price change 2019–20 (%) | 5-year median price change 2015–20 (%) | Average year built of homes sold | Number of Short Sales | Number of Bank Owned | % Distressed Sales | Average square footage of homes sold | Median Rent | Population | Population density people per sq mile) | Median age | Median household income ($) | Homeownership (%) | People below federal poverty level (%) | Unemployed (16 years and older) (%) | Households with children under 18 (%) | Married (except separated) (%) | Divorced (%) | Widowed (%) | Separated (%) | Never Married (%) | Population with bachelor degree as highest level of education (25 and older) (%) | Population with graduate degree (25 and older) (%) | English as only language (%) | People who speak other language(s) (%) | Population in same house last year (%) | Population in different county in same state last year (%) | Population in different state last year (%) | Population moved from abroad last year (%) | Total newcomers (%) | Parks and natural areas (Acres) | Minutes by car to downtown (est.) | Minutes to downtown at rush hour (est.) | Number of transit lines (bus/MAX/streetcar/tram) | Walk Score | Commute by public transit (%) | Commute by walking (%) | Commute by other non-car means (including cycling) (%) |
|---|---|---|---|---|---|---|---|---|---|---|---|---|---|---|---|---|---|---|---|---|---|---|---|---|---|---|---|---|---|---|---|---|---|---|---|---|---|---|---|---|---|---|---|---|---|
| Beaverton* | 427,725 | 439,581 | 239 | 29 | 1,447 | 332 | 23 | 7 | 47 | 1988 | 2 | 4 | 0.41 | 1,839 | 1,406 | 99,040 | 4,952 | 36 | 73,260 | 46.6 | 11.3 | 3.4 | 26.7 | 44.7 | 10 | 2.8 | 0.5 | 35.1 | 29.8 | 15.7 | 77.4 | 22.6 | 83.8 | 6.7 | 4.2 | 0.2 | 11 | 1,140 | 14 | 35 | 24 | 50 | 8.7 | 3.3 | 3.6 |
| Camas | 530,000 | 568,621 | 222 | 72 | 758 | 26 | 3 | 9 | 40 | 1971 | 2 | 2 | 0.53 | 2,565 | 1,236 | 23,200 | 1,547 | 40 | 111,584 | 77.7 | 3.5 | 2.2 | 45.1 | 63.9 | 9.2 | 2.6 | 1.2 | 23.1 | 29.2 | 23.5 | 88.8 | 11.2 | 87.5 | 0.2 | 4.8 | 0.2 | 5.2 | 1,500 | 30 | 45 | 1 | 18 | 3 | 1.5 | 1.4 |
| Canby | 439,825 | 391,844 | 212 | 32 | 277 | 2 | 1 | 10 | 58 | 1987 | 0 | 3 | 1.08 | 1,851 | 1,055 | 17,695 | 4,424 | 38 | 73,038 | 67.9 | 8.7 | 2.5 | 37.3 | 56.5 | 12.1 | 5.2 | 1.3 | 24.9 | 17.7 | 8.8 | 82.8 | 17.2 | 85.2 | 3.2 | 1 | 0.8 | 5 | 94 | 30 | 60 | 3 | 74 | 1.4 | 3.5 | 3 |
| Cornelius | 394,290 | 386,013 | 227 | 50 | 202 | 0 | 0 | 8 | 78 | 1981 | 1 | 0 | 0.5 | 1,699 | 1,102 | 12,638 | 6,319 | 32 | 67,207 | 78.5 | 6.7 | 2.3 | 46.1 | 46.7 | 9.1 | 4.7 | 1.8 | 37.6 | 11.4 | 4.3 | 47.9 | 52.1 | 85.2 | 0.5 | 2.7 | 0 | 3.2 | 40 | 35 | 45 | 2 | 62 | 4.2 | 2.6 | 0.6 |
| Estacada | 396,125 | 386,677 | 204 | 40 | 215 | 0 | 0 | 13 | 55 | 1999 | 0 | 0 | 0 | 1,895 | 1,217 | 3,426 | 1,713 | 34 | 71,088 | 73.1 | 7 | 2.3 | 33 | 58.5 | 8.7 | 7.6 | 3 | 22.2 | 12.3 | 6.5 | 96.8 | 3.2 | 83.7 | 2 | 0.5 | 0 | 2.5 | 20 | 45 | 70 | 2 | 60 | 0 | 2 | 1.1 |
| Fairview | 357,000 | 348,453 | 199 | 31 | 111 | 1 | 1 | 9 | 53 | 1993 | 0 | 1 | 0.9 | 1,748 | 1,232 | 9,363 | 2,341 | 39 | 68,259 | 58.4 | 6.9 | 3.7 | 24.6 | 53.2 | 14.1 | 4.9 | 4 | 23.9 | 13.6 | 7 | 78.7 | 21.3 | 86.6 | 2 | 4.9 | 0 | 6.9 | 350 | 22 | 45 | 2 | 54 | 4.5 | 1.7 | 0.6 |
| Forest Grove | 392,500 | 403,895 | 212 | 42 | 448 | 12 | 3 | 3 | 53 | 1984 | 0 | 1 | 0.22 | 1,909 | 1,081 | 24,457 | 4,076 | 34 | 64,172 | 59.4 | 10.6 | 3.3 | 35 | 47.3 | 10.4 | 5.6 | 1.7 | 35 | 18.4 | 10 | 80.8 | 19.2 | 81.8 | 2.7 | 3.4 | 0.5 | 6.6 | 357 | 40 | 60 | 2 | 42 | 2.6 | 5.2 | 3.3 |
| Gladstone | 415,000 | 411,164 | 214 | 21 | 159 | 1 | 1 | 11 | 48 | 1965 | 0 | 2 | 1.26 | 1,923 | 1,334 | 12,170 | 6,085 | 39 | 64,045 | 58.4 | 12.2 | 4 | 34 | 43 | 16.9 | 7.7 | 0.8 | 31.6 | 20.1 | 4.8 | 89.2 | 10.8 | 80.1 | 9.8 | 2 | 0.2 | 12 | 140 | 22 | 45 | 6 | 56 | 2.6 | 0.4 | 3.3 |
| Gresham* | 381,300 | 371,487 | 198 | 32 | 1,498 | 113 | 8 | 8 | 52 | 1963 | 3 | 13 | 1.07 | 1,875 | 1,289 | 109,379 | 4,557 | 36 | 53,892 | 52.8 | 16.5 | 6.2 | 46.3 | 45.2 | 10.6 | 3.9 | 1 | 30.7 | 16 | 8.6 | 69.7 | 30.3 | 80.4 | 5.9 | 2 | 0.5 | 8.4 | 1,140 | 24 | 50 | 13 | 45 | 6.3 | 1.4 | 1.3 |
| Happy Valley | 534,550 | 562,047 | 204 | 53 | 745 | 9 | 1 | 1 | 32 | 2000 | 0 | 4 | 0.54 | 2,759 | 1,598 | 20,971 | 2,097 | 39 | 125,676 | 84.2 | 3.1 | 1.7 | 38.9 | 62 | 7.3 | 2.9 | 1.2 | 26.5 | 33.7 | 21 | 78.1 | 21.9 | 87.4 | 3.3 | 3 | 0.4 | 6.7 | 530 | 20 | 40 | 2 | 18 | 3.2 | 0.9 | 1.5 |
| Hillsboro* | 415,000 | 414,365 | 233 | 28 | 1,617 | 185 | 11 | 6 | 54 | 1995 | 3 | 5 | 0.49 | 1,777 | 1,500 | 109,120 | 6,724 | 34 | 86,038 | 51.8 | 9.5 | 3.7 | 34.4 | 53.7 | 6.8 | 3.2 | 0.4 | 26.1 | 21.8 | 19.1 | 63.5 | 36.5 | 80.6 | 8.4 | 6.1 | 1.2 | 15.8 | 1,500 | 24 | 45 | 12 | 44 | 7.2 | 3.3 | 1.7 |
| Lake Oswego | 707,500 | 847,122 | 319 | 45 | 924 | 182 | 20 | 13 | 39 | 1979 | 0 | 2 | 0.22 | 2,659 | 1,614 | 39,127 | 3,557 | 47 | 108,927 | 73.6 | 3.9 | 2.5 | 30 | 61.2 | 10.6 | 5.3 | 0.9 | 22 | 41.3 | 30.1 | 86.2 | 13.8 | 85.8 | 4.9 | 2.9 | 1.3 | 9.1 | 460 | 18 | 35 | 4 | 37 | 3.1 | 1.6 | 1.7 |
| Maywood Park | 485,000 | 497,989 | 212 | 27 | 19 | 0 | 0 | 0 | 47 | 1940 | 0 | 0 | 0 | 2,354 | 1,550 | 995 | 5,853 | 41 | 99,750 | 86.9 | 9.3 | 2.8 | 59.9 | 59.9 | 10.7 | 3.6 | 0 | 25.7 | 26.6 | 17.4 | 94.9 | 5.1 | 93.9 | 1.6 | 1.8 | 0 | 3.4 | 9 | 14 | 40 | 0 | 60 | 12 | 0 | 6.9 |
| McMinnville | 374,000 | 378,441 | 201 | 39 | 587 | 0 | 0 | 10 | 61 | 1979 | 0 | 0 | 0 | 1,879 | 987 | 34,010 | 3,092 | 36 | 54,254 | 61.9 | 14.3 | 2.2 | 30.1 | 45.7 | 14.9 | 7.6 | 1.7 | 30.2 | 15.8 | 10.2 | 81.6 | 18.4 | 82.6 | 3.8 | 2.7 | 0.5 | 7 | 293 | 55 | 80 | 8 | 40 | 0.9 | 8.2 | 3.1 |
| Milwaukie | 422,000 | 424,640 | 230 | 24 | 298 | 19 | 6 | 10 | 57 | 1963 | 0 | 3 | 1.01 | 1,843 | 1,173 | 21,009 | 4,202 | 41 | 61,902 | 58.8 | 11.2 | 2.8 | 23.5 | 43.6 | 16 | 5.9 | 1.2 | 33.3 | 23.1 | 13.1 | 92.2 | 7.8 | 83.6 | 7.5 | 4.3 | 0.2 | 12 | 110 | 12 | 25 | 11 | 51 | 7.4 | 2 | 3.5 |
| Newberg | 423,750 | 386,360 | 220 | 32 | 438 | 17 | 4 | 13 | 67 | 1983 | 2 | 3 | 1.14 | 1,756 | 1,125 | 23,396 | 3,899 | 34 | 64,202 | 65 | 15.8 | 2.6 | 34.4 | 47.1 | 11.2 | 3.9 | 1.1 | 36.6 | 21.7 | 9.8 | 87.7 | 12.3 | 81.9 | 7.6 | 2.9 | 0.3 | 10.8 | 622 | 35 | 55 | 3 | 45 | 0.5 | 7.2 | 3 |
| Oregon City | 474,700 | 448,892 | 220 | 36 | 646 | 4 | 1 | 9 | 60 | 1988 | 1 | 4 | 0.77 | 2,040 | 1,275 | 36,492 | 3,649 | 38 | 76,149 | 66.2 | 7.6 | 3.6 | 35.6 | 51.7 | 13.8 | 4.6 | 1.7 | 28.2 | 19.3 | 7 | 93.6 | 6.4 | 81.5 | 4.8 | 1.6 | 0.1 | 6.5 | 395 | 28 | 45 | 10 | 37 | 2 | 2.2 | 1.8 |
| Portland* | 464,350 | 510,313 | 266 | 34 | 10,180 | 1,662 | 16 | 7 | 41 | 1959 | 16 | 65 | 0.8 | 1,918 | 1,312 | 653,467 | 4,506 | 37 | 76,231 | 53.8 | 13.7 | 3.8 | 24.2 | 39.7 | 10.8 | 3.1 | 1.1 | 36.2 | 31.4 | 21.4 | 76.9 | 23.1 | 81.7 | 7.1 | 6.1 | 0.6 | 13.8 | 12,882 | – | – | 90 | 67 | 12.7 | 5.9 | 6.6 |
| Sauvie Island | 804,909 | 737,444 | 336 | 38 | 10 | 0 | 0 | 100 | 13 | 1969 | 0 | 1 | 10 | 2,197 | 1,422 | 2,567 | 81 | 53 | 95,000 | 84.2 | 8.1 | 3.1 | 22.3 | 53.7 | 12.6 | 3.5 | 1.2 | 28.9 | 31.4 | 13 | 95.8 | 4.2 | 87.5 | 9 | 3.5 | 0 | 12.5 | 11,543 | 35 | 40 | 1 | 6 | 10.9 | 8 | 9.2 |
| Scappoose | 388,500 | 378,105 | 199 | 28 | 195 | 1 | 1 | 9 | 48 | 1993 | 0 | 2 | 1.03 | 1,896 | 1,250 | 7,270 | 2,423 | 36 | 80,171 | 68.8 | 8.8 | 1.6 | 34.2 | 51.7 | 12.7 | 6.6 | 2.4 | 26.6 | 17.7 | 8.9 | 94.5 | 5.5 | 81.8 | 7.6 | 1.4 | 0 | 9 | 21 | 19 | 45 | 2 | 77 | 1.2 | 1.5 | 0.4 |
| Sherwood | 515,000 | 490,215 | 235 | 20 | 364 | 30 | 8 | 18 | 61 | 1993 | 0 | 2 | 0.55 | 2,086 | 1,485 | 19,625 | 4,906 | 37 | 103,512 | 77.3 | 2.9 | 1.3 | 45 | 61 | 9 | 3.8 | 0.8 | 25.4 | 32.4 | 17.6 | 89.7 | 10.3 | 84.2 | 4.3 | 3 | 0.2 | 7.5 | 240 | 31 | 40 | 4 | 38 | 1 | 2.8 | 0.6 |
| St.Helens | 322,000 | 308,920 | 190 | 38 | 274 | 2 | 1 | 9 | 57 | 1969 | 1 | 9 | 3.65 | 1,623 | 901 | 13,559 | 2,260 | 38 | 51,199 | 61.2 | 16.8 | 3.8 | 36.6 | 41.6 | 17.3 | 6.8 | 1.7 | 32.6 | 11 | 4.8 | 96.1 | 3.9 | 82.2 | 4.8 | 3.7 | 0 | 8.5 | 134 | 21 | 50 | 10 | 76 | 0.5 | 3.4 | 2.4 |
| Tigard | 481,000 | 487,212 | 230 | 29 | 1,041 | 95 | 9 | 9 | 46 | 1983 | 1 | 6 | 0.67 | 2,117 | 1,243 | 53,312 | 4,101 | 37 | 79,809 | 61.5 | 8.9 | 2.6 | 31.1 | 51.7 | 11.1 | 4.8 | 1.4 | 31 | 28.5 | 15.7 | 80.3 | 19.7 | 85.4 | 3.6 | 2.7 | 0.5 | 6.8 | 550 | 25 | 45 | 4 | 41 | 6.2 | 1.8 | 1.1 |
| Troutdale | 380,000 | 374,589 | 211 | 22 | 240 | 9 | 4 | 8 | 55 | 1990 | 0 | 2 | 0.83 | 1,774 | 1,195 | 16,466 | 2,744 | 35 | 76,598 | 66.3 | 9.8 | 3.2 | 37.9 | 50.6 | 11.1 | 2.9 | 1.1 | 34.3 | 17.4 | 5.5 | 80.8 | 19.2 | 86.5 | 0.9 | 1.6 | 0.7 | 3.2 | 1,200 | 45 | 50 | 5 | 58 | 4.6 | 2 | 2.3 |
| Tualatin | 489,950 | 477,813 | 227 | 21 | 379 | 44 | 12 | 5 | 41 | 1989 | 2 | 0 | 0.53 | 2,105 | 1,335 | 27,527 | 3,441 | 38 | 85,772 | 56.2 | 10.2 | 2.6 | 32.4 | 53.6 | 11.5 | 2.9 | 1.4 | 30.7 | 29.1 | 16.2 | 82.7 | 17.3 | 86 | 5.6 | 3.3 | 0.2 | 9.1 | 360 | 20 | 35 | 15 | 27 | 3.7 | 2.3 | 0.8 |
| Vancouver* | 379,000 | 387,617 | 223 | 28 | 2,571 | 296 | 12 | 8 | 63 | 1982 | 2 | 10 | 0.47 | 1,736 | 1,343 | 184,452 | 3,689 | 37 | 66,679 | 48.4 | 12.7 | 4.7 | 29.3 | 42.5 | 11.7 | 5.5 | 2.3 | 27.8 | 21.3 | 10.3 | 74.8 | 25.2 | 77.9 | 8.4 | 6.8 | 1.2 | 16.4 | 1,600 | 14 | 45 | 4 | 40 | 3.7 | 1.9 | 3.2 |
| Washougal | 446,950 | 449,233 | 197 | 38 | 327 | 4 | 1 | 12 | 49 | 1996 | 0 | 1 | 0.31 | 2,276 | 1,171 | 15,769 | 2,628 | 40 | 91,100 | 76.2 | 7.4 | 2.4 | 36.4 | 58.9 | 11.7 | 4.3 | 1.3 | 23.9 | 22.1 | 10 | 94 | 6 | 84.6 | 0.7 | 3.8 | 0.3 | 4.8 | 300 | 18 | 40 | 11 | 53 | 1.1 | 2.4 | 0.4 |
| West Linn | 599,000 | 604,197 | 226 | 37 | 577 | 75 | 13 | 8 | 41 | 1987 | 0 | 8 | 1.39 | 2,670 | 1,588 | 26,656 | 3,332 | 42 | 111,042 | 81.6 | 5.1 | 3.2 | 37.4 | 62.2 | 10.7 | 3.4 | 0.5 | 23.2 | 37.5 | 24 | 86.4 | 13.6 | 88.9 | 4.2 | 2.3 | 0.6 | 7.1 | 602 | 15 | 40 | 30 | 34 | 3.1 | 1.2 | 0.7 |
| Wilsonville | 479,900 | 486,211 | 231 | 32 | 486 | 44 | 9 | 4 | 30 | 1997 | 0 | 1 | 0.21 | 2,103 | 1,360 | 24,073 | 3,009 | 36 | 72,312 | 45.4 | 9.7 | 2.5 | 28.7 | 49.9 | 14.9 | 4.9 | 1.5 | 28.8 | 29.4 | 16.4 | 86.7 | 13.3 | 78.1 | 8.7 | 4.7 | 0.8 | 14.2 | 198 | 27 | 55 | 1 | 28 | 2.1 | 1.5 | 2.9 |
| Wood Village | 299,900 | 310,929 | 194 | 32 | 50 | 21 | 42 | -20 | 66 | 1980 | 1 | 0 | 2 | 1,602 | – | 4,057 | 4,057 | 31 | 56,905 | 45.6 | 16.9 | 2.1 | 58.5 | 36.3 | 12.5 | 3.8 | 2.2 | 45.2 | 8.2 | 3.6 | 43.6 | 56.4 | 86.6 | 4.1 | 1.8 | 0 | 5.9 | 21 | 18 | 40 | 2 | 47 | 7.3 | 3 | 2.7 |
Methodology
Real Estate
2020 data from the Regional Multiple Listing Service with analysis by the Center for Spatial Analysis and Research at Portland State University’s Department of Geography. Figures were rounded for legibility. In neighborhoods with very few home sales, such as Sunderland and Healy Heights, the year-to-year change can appear exaggerated.
People
Data from the US Census Bureau’s American Community Survey 5-Year Estimates, released December 2020. The ACS data are estimates only and accuracy varies by attribute.
Rent Costs
Calculated from all renter-occupied units, estimated median rent is not adjusted for unit size or number of occupants. Figure includes estimated monthly utility costs.
Median Income
The Census defines household as including “all the persons who occupy a housing unit as their usual place of residence.” Thus living situations in this estimate range from individuals to large households.
Parks
Data from Metro and/or individual cities.
Transit
Transit information was sourced from TriMet as well as other services, including CC Rider, C-TRAN, Canby Area Transit, Sandy Area Metro, and South Metro Area Regional Transit.
Prepandemic Google Maps estimate, based on non-rush-hour conditions, from a neighborhood/suburb central point to Portland’s Pioneer Courthouse Square. Rush-hour travel time was estimated for a 9 a.m. weekday arrival.
Walk Score
2021 data from WalkScore.com, now a part of real estate agency Redfin. This score reflects, on a scale of 1 to 100, a neighborhood’s pedestrian-friendliness based on distances to amenities such as grocery stores and other routine destinations. For some cities and neighborhoods with a commercial central point or a large nonresidential area (such as Forest Park), the score was taken from a point in a central residential portion.
Unavailable Data is noted with a dash (—).
Real estate and US Census data analysis by David Banis, Paige Burnett, and Gabriel Egli of PSU’s Center for Spatial Analysis and Research