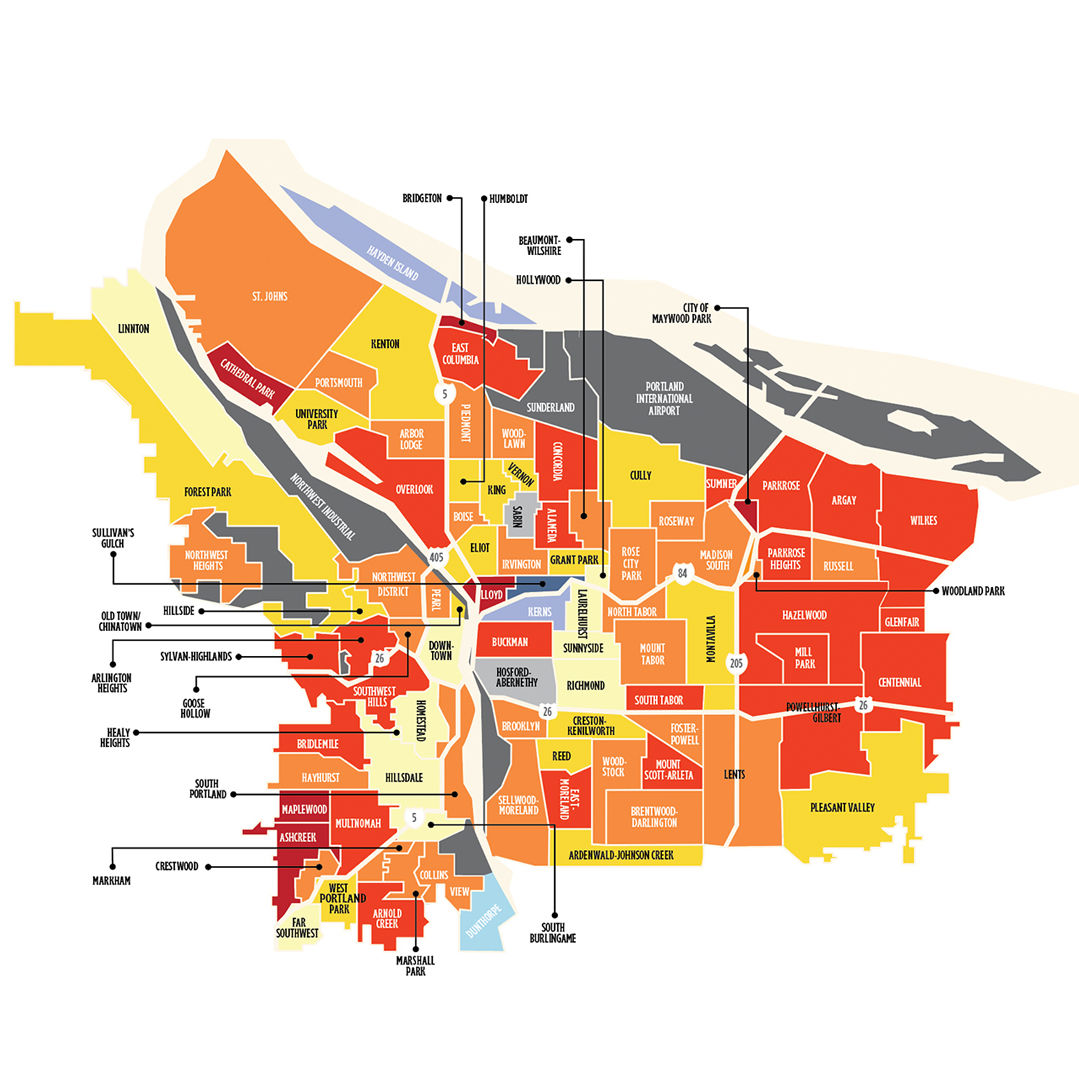
Portland Neighborhoods by the Numbers 2022

Which The Fast and the Furious sequel is this? In 2021 sales in the city sped up, with an average of 25 days on the market vs. 2020’s 34 days. Median home sales prices were up in nearly every neighborhood, and in some cases by a lot—enough to make some of us wish we’d picked up flipping houses as our pandemic hobby. Will it continue? Is this a recovery or an anomaly? And in the Portland Fast and the Furious, what neighborhood does Vin Diesel live in? We’re not sure about the first two answers, but the third is Montavilla, with room for the family and easy highway access.
| Neighborhood | Median 2021 home sale price ($) | Average 2021 home sale price ($) | Homes sold in 2021 (#) | 1-year median price change 2020-21 (%) | 5-year median price change 2016-21 (%) | Days on market (average) | Condo sales among home sales (#) | Share of 2021 sales that were condos (%) | Short sales | Bank-owned sales | Average square feet of homes sold | Average cost per square foot ($) | Average year built of homes sold | Renters' median monthly housing ($) | Population | Population density people per sq mile) | Median age | Median household income ($) | Homeownership (%) | People below federal poverty level (%) | Unemployed (16 years and older) (%) | Households with children under 18 (%) | Married (except separated) (%) | Divorced (%) | Widowed (%) | Separated (%) | Never Married (%) | Population with bachelor degree as highest level of education (25 and older) (%) | Population with graduate degree (25 and older) (%) | English as only language (%) | People who speak other language(s) (%) | Population in same house a year before (%) | Population in different Oregon county in past year (%) | Population in different state in past year (%) | Population moved from abroad in past year (%) | Total newcomers (%) | Assault | Homicide | Sex offenses | Arson | Robbery | Burglary | Larceny | Motor vehicle thefts | Vandalism | Drug/narcotic offenses | Violent crimes per 1,000 residents | Burglary/larceny/vehicle theft crimes per 1,000 residents | Vehicle thefts per square mile | Miles of bike routes | Area of neighborhood in square miles | Miles of bike route per square mile | Park area in square miles | Parks and natural areas (% of neighborhood) | Estimated time by car to downtown (min.) | Number of transit lines (bus/MAX/streetcar/tram) | Walk Score |
|---|---|---|---|---|---|---|---|---|---|---|---|---|---|---|---|---|---|---|---|---|---|---|---|---|---|---|---|---|---|---|---|---|---|---|---|---|---|---|---|---|---|---|---|---|---|---|---|---|---|---|---|---|---|---|---|---|---|
| ALAMEDA | 877,500 | 962,231 | 98 | 15 | 30 | 11 | 0 | 0 | 0 | 0 | 3,010 | 320 | 1930 | 1,945 | 5,777 | 9,679 | 42 | 124,589 | 82 | 4 | 4 | 36 | 57.1 | 3.0 | 10.4 | 0.7 | 28.9 | 37.9 | 37.8 | 92.0 | 8.0 | 87.9 | 1.5 | 3.4 | 0.4 | 5.3 | 7 | 0 | 3 | 0 | 2 | 14 | 79 | 63 | 32 | 0 | 2 | 27 | 105.6 | 0.77 | 0.60 | 1.29 | 0.00 | 0 | 12 | 3 | 64 |
| ARBOR LODGE | 550,000 | 536,888 | 170 | 10 | 28 | 41 | 24 | 14 | 0 | 0 | 1,806 | 297 | 1954 | 1,438 | 7,289 | 8,400 | 37 | 86,530 | 65 | 8 | 4 | 25 | 42.9 | 2.4 | 9.5 | 1.2 | 44.1 | 36.7 | 21.1 | 85.0 | 15.0 | 84.7 | 0.4 | 3.1 | 0.7 | 4.2 | 71 | 0 | 1 | 7 | 18 | 48 | 228 | 144 | 83 | 5 | 13 | 58 | 165.9 | 6.35 | 0.87 | 7.31 | 0.02 | 2 | 10 | 5 | 79 |
| ARDENWALD-JOHNSON CREEK | 535,000 | 637,264 | 11 | 9 | 43 | 10 | 0 | 0 | 0 | 0 | 1,921 | 332 | 1959 | 1,798 | 1,765 | 6,228 | 41 | - | 84 | 5 | 5 | 40 | 61.9 | 3.9 | 10.8 | 1.8 | 21.6 | 33.6 | 34.1 | 88.5 | 11.5 | 86.6 | 1.9 | 4.5 | 0.2 | 6.6 | 5 | 0 | 0 | 0 | 0 | 1 | 0 | 6 | 5 | 0 | 3 | 4 | 17.9 | 2.56 | 0.34 | 7.61 | 0.06 | 17 | 14 | 6 | 57 |
| ARGAY | 492,000 | 479,252 | 82 | 16 | 52 | 15 | 7 | 9 | 0 | 0 | 2,096 | 229 | 1968 | 934 | 5,763 | 2,807 | 41 | 54,267 | 50 | 24 | 6 | 25 | 27.7 | 5.7 | 17.1 | 3.4 | 46.2 | 11.9 | 6.1 | 82.7 | 17.3 | 66.3 | 16.7 | 4.9 | 0.3 | 21.9 | 107 | 2 | 5 | 3 | 7 | 37 | 255 | 137 | 87 | 2 | 22 | 74 | 66.7 | 5.92 | 2.05 | 2.88 | 0.09 | 5 | 18 | 5 | 44 |
| ARLINGTON HEIGHTS | 1,016,306 | 1,196,340 | 18 | 15 | 17 | 41 | 0 | 0 | 0 | 0 | 3,614 | 331 | 1958 | 1,200 | 1,932 | 2,365 | 52 | 161,392 | 82 | 3 | 2 | 20 | 63.3 | 4.6 | 8.4 | 0.2 | 23.6 | 34.8 | 46.8 | 87.0 | 13.0 | 92.5 | 0.4 | 2.6 | 1.5 | 4.5 | 2 | 0 | 0 | 0 | 1 | 6 | 60 | 1 | 19 | 0 | 2 | 35 | 1.2 | 1.51 | 0.82 | 1.84 | 0.51 | 63 | 12 | 6 | 35 |
| ARNOLD CREEK | 767,700 | 801,380 | 71 | 16 | 34 | 18 | 0 | 0 | 0 | 0 | 2,752 | 291 | 1981 | 1,505 | 2,808 | 2,567 | 43 | 142,929 | 91 | 5 | 1 | 37 | 68.6 | 2.3 | 9.5 | 0.4 | 19.1 | 42.3 | 36.5 | 92.6 | 7.4 | 88.3 | 1.9 | 1.8 | 0.6 | 4.3 | 6 | 0 | 0 | 0 | 0 | 5 | 12 | 3 | 0 | 0 | 2 | 7 | 2.7 | 0.26 | 1.10 | 0.24 | 0.03 | 3 | 16 | 1 | 20 |
| ASHCREEK | 604,500 | 635,722 | 108 | 21 | 33 | 18 | 6 | 6 | 0 | 0 | 2,148 | 296 | 1976 | 1,763 | 4,911 | 4,474 | 43 | 107,840 | 86 | 3 | 4 | 29 | 53.9 | 4.5 | 20.3 | 0.3 | 21.1 | 35.2 | 31.4 | 92.5 | 7.5 | 84.5 | 2.6 | 4.1 | 0.5 | 7.3 | 25 | 0 | 3 | 0 | 1 | 8 | 59 | 16 | 11 | 0 | 6 | 17 | 13.4 | 1.64 | 1.19 | 1.37 | 0.02 | 2 | 16 | 8 | 35 |
| BEAUMONT-WILSHIRE | 750,000 | 845,648 | 135 | 10 | 33 | 14 | 1 | 1 | 0 | 0 | 2,569 | 329 | 1938 | 1,483 | 6,219 | 8,166 | 41 | 124,950 | 89 | 3 | 2 | 36 | 57.5 | 2.2 | 8.7 | 1.4 | 30.3 | 37.2 | 31.5 | 88.7 | 11.3 | 89.5 | 1.2 | 1.9 | 0.1 | 3.2 | 0 | 1 | 0 | 0 | 4 | 28 | 101 | 59 | 24 | 0 | 1 | 30 | 77.5 | 4.41 | 0.76 | 5.80 | 0.02 | 3 | 14 | 3 | 78 |
| BOISE | 580,000 | 615,073 | 83 | 10 | 16 | 27 | 20 | 24 | 0 | 0 | 1,869 | 329 | 1945 | 1,557 | 4,726 | 11,045 | 34 | 84,168 | 33 | 14 | 3 | 14 | 31.7 | 1.3 | 12.0 | 0.8 | 54.1 | 41.9 | 25.4 | 88.2 | 11.8 | 71.7 | 2.7 | 10.2 | 1.7 | 14.6 | 41 | 0 | 3 | 8 | 3 | 60 | 191 | 147 | 67 | 0 | 12 | 84 | 343.6 | 2.19 | 0.43 | 5.13 | 0.01 | 2 | 9 | 7 | 93 |
| BRENTWOOD-DARLINGTON | 412,000 | 427,386 | 300 | 13 | 45 | 18 | 15 | 5 | 0 | 0 | 1,403 | 305 | 1966 | 1,460 | 13,127 | 7,525 | 38 | 63,721 | 68 | 11 | 5 | 28 | 41.9 | 3.9 | 15.5 | 2.0 | 36.8 | 21.6 | 10.6 | 71.7 | 28.3 | 86.3 | 1.7 | 3.4 | 0.3 | 5.5 | 159 | 0 | 13 | 5 | 14 | 54 | 172 | 95 | 78 | 8 | 15 | 24 | 54.2 | 6.30 | 1.75 | 3.60 | 0.08 | 4 | 20 | 4 | 65 |
| BRIDGETON | 374,000 | 406,027 | 30 | 21 | 39 | 45 | 5 | 17 | 0 | 0 | 1,684 | 241 | 1991 | 1,595 | 63 | 235 | 44 | 73,026 | 65 | 11 | 1 | 19 | 43.6 | 2.6 | 11.7 | 3.5 | 38.5 | 26.2 | 9.5 | 75.1 | 24.9 | 83.7 | 1.5 | 2.4 | 0.1 | 4.0 | 18 | 0 | 0 | 0 | 1 | 6 | 67 | 37 | 21 | 0 | 300 | 1736 | 137.3 | 3.14 | 0.27 | 11.64 | 0.00 | 1 | 15 | 2 | 22 |
| BRIDLEMILE* | 815,000 | 932,180 | 89 | 17 | 38 | 17 | 0 | 0 | 0 | 0 | 2,811 | 332 | 1973 | 1,150 | 4,899 | 3,509 | 45 | 115,224 | 73 | 10 | 3 | 32 | 58.8 | 4.4 | 10.2 | 1.0 | 25.7 | 29.2 | 40.8 | 88.6 | 11.4 | 87.4 | 3.6 | 4.1 | 0.7 | 8.4 | 13 | 0 | 3 | 0 | 2 | 10 | 53 | 13 | 21 | 0 | 4 | 16 | 11.2 | 2.34 | 1.16 | 2.01 | 0.05 | 4 | 13 | 5 | 41 |
| BROOKLYN | 553,078 | 582,640 | 60 | 10 | 23 | 18 | 0 | 0 | 0 | 0 | 2,048 | 285 | 1933 | 1,244 | 7,910 | 4,607 | 40 | 85,869 | 55 | 9 | 5 | 27 | 45.5 | 2.6 | 14.5 | 1.5 | 35.9 | 35.8 | 28.4 | 92.2 | 7.8 | 81.8 | 5.7 | 5.7 | 0.8 | 12.2 | 36 | 0 | 3 | 1 | 12 | 58 | 161 | 60 | 57 | 0 | 7 | 35 | 35.0 | 4.83 | 1.72 | 2.82 | 0.05 | 3 | 9 | 9 | 82 |
| BUCKMAN | 662,500 | 661,199 | 73 | 16 | 25 | 14 | 15 | 21 | 0 | 0 | 2,192 | 302 | 1933 | 1,230 | 8,943 | 7,749 | 34 | 50,041 | 12 | 21 | 4 | 8 | 22.7 | 1.4 | 12.1 | 3.0 | 60.8 | 38.6 | 18.1 | 91.4 | 8.6 | 68.2 | 5.8 | 7.4 | 0.4 | 13.6 | 246 | 2 | 16 | 14 | 28 | 223 | 828 | 280 | 403 | 3 | 34 | 149 | 242.7 | 9.42 | 1.15 | 8.17 | 0.02 | 2 | 7 | 12 | 92 |
| CATHEDRAL PARK | 498,750 | 487,623 | 100 | 30 | 73 | 14 | 23 | 23 | 0 | 0 | 1,680 | 290 | 1962 | 1,245 | 5,113 | 4,984 | 35 | 72,427 | 56 | 12 | 3 | 23 | 34.9 | 3.9 | 15.0 | 1.1 | 45.1 | 32.6 | 18.6 | 86.5 | 13.5 | 81.6 | 1.3 | 5.4 | 0.2 | 6.9 | 37 | 2 | 2 | 4 | 5 | 20 | 98 | 71 | 35 | 0 | 10 | 37 | 69.2 | 2.03 | 1.03 | 1.98 | 0.10 | 10 | 22 | 4 | 80 |
| CENTENNIAL | 390,000 | 380,861 | 385 | 15 | 56 | 19 | 43 | 11 | 1 | 2 | 1,478 | 258 | 1968 | 1,136 | 24,061 | 7,370 | 35 | 50,517 | 60 | 21 | 7 | 37 | 44.0 | 5.0 | 13.7 | 2.0 | 35.3 | 10.9 | 4.1 | 60.3 | 39.7 | 83.2 | 2.7 | 1.6 | 0.7 | 4.9 | 468 | 4 | 21 | 0 | 43 | 108 | 486 | 231 | 244 | 12 | 22 | 34 | 70.8 | 7.23 | 3.26 | 2.22 | 0.13 | 4 | 25 | 4 | 58 |
| COLLINS VIEW | 608,750 | 749,370 | 46 | 11 | 43 | 21 | 0 | 0 | 0 | 0 | 2,459 | 305 | 1969 | 1,595 | 2,118 | 2,437 | 32 | 130,675 | 86 | 9 | 5 | 32 | 49.6 | 1.7 | 4.9 | 0.3 | 43.3 | 36.1 | 38.2 | 87.2 | 12.8 | 79.1 | 5.6 | 8.6 | 1.1 | 15.3 | 9 | 0 | 0 | 0 | 0 | 9 | 22 | 3 | 0 | 0 | 4 | 16 | 3.5 | 1.62 | 0.87 | 1.86 | 0.01 | 1 | 14 | 4 | 25 |
| CONCORDIA | 629,900 | 626,228 | 227 | 18 | 37 | 24 | 15 | 7 | 0 | 1 | 2,099 | 298 | 1944 | 1,704 | 10,246 | 7,723 | 38 | 104,513 | 77 | 6 | 4 | 31 | 44.2 | 2.9 | 11.2 | 1.8 | 39.9 | 34.7 | 24.1 | 92.2 | 7.8 | 88.0 | 1.9 | 4.1 | 0.2 | 6.2 | 50 | 0 | 1 | 1 | 13 | 41 | 228 | 139 | 60 | 0 | 6 | 40 | 104.8 | 2.80 | 1.33 | 2.11 | 0.04 | 3 | 15 | 4 | 76 |
| CRESTON-KENILWORTH | 525,000 | 547,946 | 131 | 6 | 24 | 12 | 10 | 8 | 0 | 0 | 1,880 | 292 | 1950 | 1,169 | 8,958 | 11,160 | 34 | 61,972 | 41 | 14 | 5 | 25 | 33.2 | 2.6 | 11.2 | 3.2 | 49.9 | 32.3 | 16.7 | 86.4 | 13.6 | 79.3 | 3.2 | 4.7 | 0.5 | 8.4 | 95 | 2 | 5 | 6 | 9 | 56 | 284 | 132 | 85 | 2 | 13 | 53 | 164.5 | 4.17 | 0.80 | 5.20 | 0.04 | 4 | 12 | 7 | 81 |
| CRESTWOOD | 529,000 | 561,229 | 39 | 11 | 27 | 9 | 0 | 0 | 0 | 0 | 1,828 | 307 | 1981 | 1,781 | 1,503 | 4,454 | 43 | 109,022 | 87 | 3 | 4 | 30 | 54.5 | 4.5 | 20.5 | 0.3 | 20.1 | 35.2 | 31.3 | 92.4 | 7.6 | 85.1 | 2.3 | 4.1 | 0.5 | 7.0 | 3 | 0 | 0 | 0 | 1 | 2 | 20 | 4 | 1 | 0 | 3 | 17 | 11.9 | 0.00 | 0.34 | 0.00 | 0.09 | 26 | 16 | 5 | 47 |
| CULLY | 454,200 | 484,353 | 206 | 7 | 34 | 25 | 23 | 11 | 0 | 1 | 1,555 | 312 | 1958 | 1,019 | 13,671 | 4,356 | 36 | 57,245 | 54 | 25 | 5 | 30 | 30.4 | 2.8 | 15.6 | 2.9 | 48.3 | 18.4 | 9.7 | 74.6 | 25.4 | 72.5 | 10.4 | 3.8 | 0.4 | 14.7 | 197 | 3 | 11 | 9 | 19 | 74 | 318 | 215 | 118 | 3 | 17 | 44 | 68.5 | 4.36 | 3.14 | 1.39 | 0.09 | 3 | 16 | 4 | 58 |
| DOWNTOWN | 367,500 | 427,671 | 169 | 1 | 7 | 73 | 169 | 100 | 0 | 0 | 1,073 | 398 | 1982 | 1,148 | 12,242 | 12,985 | 41 | 41,344 | 17 | 31 | 8 | 3 | 21.8 | 3.7 | 15.9 | 3.0 | 55.6 | 24.9 | 23.0 | 83.3 | 16.7 | 60.8 | 7.9 | 13.2 | 2.7 | 23.7 | 697 | 2 | 39 | 32 | 96 | 259 | 1708 | 192 | 935 | 12 | 71 | 176 | 203.7 | 15.26 | 0.94 | 16.18 | 0.07 | 7 | 0 | 40 | 96 |
| DUNTHORPE | 1,625,000 | 1,776,965 | 49 | -4 | 18 | 41 | 0 | 0 | 0 | 0 | 4,755 | 374 | 1961 | 1,596 | 2,880 | 2,457 | 32 | 130,568 | 86 | 9 | 5 | 32 | 49.5 | 1.7 | 4.9 | 0.3 | 43.5 | 36.1 | 38.2 | 87.2 | 12.8 | 79.0 | 5.6 | 8.7 | 1.1 | 15.4 | - | - | - | - | - | - | - | - | - | - | - | - | - | 2.49 | 1.18 | 2.11 | 0.01 | 1 | 18 | 2 | 11 |
| EAST COLUMBIA | 442,000 | 541,695 | 20 | 15 | 36 | 27 | 0 | 0 | 0 | 0 | 2,482 | 218 | 1977 | 1,590 | 525 | 234 | 44 | 72,846 | 64 | 11 | 1 | 19 | 43.4 | 2.6 | 11.8 | 3.5 | 38.6 | 26.1 | 9.5 | 75.1 | 24.9 | 83.5 | 1.7 | 2.4 | 0.1 | 4.2 | 72 | 2 | 4 | 8 | 28 | 43 | 282 | 131 | 76 | 3 | 217 | 869 | 58.4 | 8.52 | 2.24 | 3.80 | 0.23 | 10 | 18 | 2 | 14 |
| EASTMORELAND | 925,000 | 957,755 | 101 | 17 | 26 | 14 | 0 | 0 | 0 | 0 | 3,118 | 307 | 1945 | 1,688 | 6,940 | 6,247 | 38 | 114,468 | 72 | 7 | 5 | 34 | 54.1 | 4.3 | 8.8 | 1.4 | 31.4 | 33.4 | 33.8 | 89.4 | 10.6 | 80.6 | 2.8 | 6.6 | 0.6 | 10.0 | 5 | 0 | 0 | 2 | 0 | 13 | 79 | 20 | 15 | 0 | 1 | 16 | 18.0 | 2.64 | 1.11 | 2.38 | 0.03 | 3 | 14 | 6 | 53 |
| ELIOT | 575,000 | 600,191 | 95 | 7 | 41 | 41 | 28 | 29 | 0 | 0 | 2,068 | 290 | 1937 | 1,324 | 4,647 | 5,497 | 35 | 63,538 | 22 | 18 | 5 | 9 | 23.4 | 4.1 | 15.1 | 1.5 | 55.7 | 37.6 | 23.3 | 90.5 | 9.5 | 66.6 | 4.6 | 9.7 | 0.6 | 14.9 | 190 | 3 | 9 | 13 | 17 | 93 | 664 | 142 | 167 | 2 | 50 | 193 | 168.0 | 6.91 | 0.85 | 8.18 | 0.01 | 1 | 8 | 10 | 89 |
| FAR SOUTHWEST | 555,000 | 622,192 | 47 | 1 | 31 | 14 | 3 | 6 | 0 | 0 | 2,146 | 290 | 1990 | 1,657 | 2,199 | 3,693 | 45 | 87,189 | 69 | 9 | 4 | 19 | 51.8 | 4.9 | 14.3 | 0.2 | 28.9 | 36.6 | 25.3 | 91.1 | 8.9 | 80.4 | 7.3 | 4.7 | 0.3 | 12.3 | 3 | 0 | 1 | 3 | 0 | 3 | 15 | 9 | 14 | 0 | 3 | 12 | 15.1 | 1.86 | 0.60 | 3.13 | 0.02 | 3 | 16 | 6 | 38 |
| FOREST PARK* | 999,000 | 1,072,322 | 40 | 9 | 19 | 51 | 0 | 0 | 0 | 0 | 3,888 | 276 | 1981 | 1,468 | 3,145 | 172 | 46 | 143,707 | 83 | 5 | 3 | 32 | 62.5 | 2.7 | 10.3 | 0.0 | 24.5 | 33.7 | 38.5 | 83.6 | 16.4 | 89.2 | 3.4 | 3.0 | 1.1 | 7.5 | 16 | 0 | 3 | 0 | 0 | 5 | 132 | 8 | 36 | 0 | 6 | 46 | 0.8 | 19.62 | 10.26 | 1.91 | 7.55 | 74 | 24 | 3 | 4 |
| FOSTER-POWELL | 479,000 | 483,534 | 159 | 12 | 34 | 17 | 3 | 2 | 1 | 0 | 1,640 | 295 | 1929 | 1,365 | 8,791 | 9,878 | 37 | 68,668 | 60 | 18 | 3 | 30 | 35.0 | 5.3 | 16.8 | 1.5 | 41.5 | 27.7 | 16.5 | 79.8 | 20.2 | 84.2 | 2.4 | 2.1 | 1.9 | 6.4 | 94 | 0 | 5 | 2 | 18 | 54 | 175 | 98 | 100 | 4 | 14 | 37 | 110.1 | 1.80 | 0.89 | 2.02 | 0.01 | 1 | 18 | 6 | 86 |
| GLENFAIR | 400,000 | 409,211 | 29 | 18 | 46 | 23 | 0 | 0 | 0 | 0 | 1,558 | 263 | 1977 | 1,108 | 3,271 | 10,308 | 33 | 48,195 | 36 | 27 | 8 | 41 | 31.8 | 5.1 | 15.8 | 3.1 | 44.1 | 14.0 | 7.3 | 64.7 | 35.3 | 85.5 | 1.1 | 4.3 | 0.7 | 6.1 | 159 | 0 | 0 | 2 | 0 | 12 | 61 | 46 | 50 | 0 | 49 | 36 | 145.0 | 1.85 | 0.32 | 5.84 | 0.01 | 2 | 20 | 3 | 61 |
| GOOSE HOLLOW | 365,000 | 465,002 | 112 | 11 | 3 | 60 | 97 | 87 | 0 | 1 | 1,269 | 367 | 1977 | 1,216 | 5,136 | 15,143 | 38 | 71,408 | 29 | 24 | 6 | 9 | 30.7 | 3.2 | 14.4 | 1.0 | 50.7 | 38.7 | 26.8 | 85.0 | 15.0 | 66.5 | 3.6 | 9.8 | 2.4 | 15.8 | 113 | 2 | 7 | 9 | 13 | 83 | 309 | 71 | 164 | 1 | 28 | 90 | 209.4 | 1.34 | 0.34 | 3.96 | 0.00 | 1 | 6 | 15 | 94 |
| GRANT PARK | 815,000 | 897,264 | 71 | 6 | 20 | 17 | 0 | 0 | 0 | 0 | 2,871 | 313 | 1925 | 1,448 | 4,034 | 8,839 | 43 | 117,043 | 79 | 5 | 4 | 34 | 59.4 | 2.4 | 8.5 | 0.7 | 29.1 | 42.9 | 35.5 | 90.6 | 9.4 | 85.1 | 1.4 | 2.8 | 0.5 | 4.7 | 15 | 0 | 2 | 3 | 2 | 19 | 80 | 46 | 32 | 0 | 5 | 36 | 100.8 | 2.40 | 0.46 | 5.25 | 0.03 | 7 | 15 | 3 | 84 |
| HAYDEN ISLAND | 340,000 | 380,390 | 99 | -9 | 31 | 49 | 61 | 62 | 0 | 0 | 1,503 | 253 | 1982 | 1,293 | 2,378 | 739 | 53 | 87,684 | 72 | 8 | 1 | 11 | 40.4 | 3.0 | 29.4 | 2.3 | 24.9 | 18.2 | 14.8 | 92.5 | 7.5 | 84.9 | 2.3 | 4.3 | 0.3 | 6.9 | 89 | 0 | 4 | 12 | 18 | 39 | 611 | 193 | 108 | 2 | 52 | 354 | 60.0 | 1.63 | 3.22 | 0.51 | 0.00 | 0 | 12 | 1 | 36 |
| HAYHURST | 598,000 | 593,652 | 102 | 13 | 33 | 22 | 18 | 18 | 0 | 0 | 2,002 | 297 | 1970 | 1,370 | 6,059 | 5,391 | 39 | 103,615 | 67 | 7 | 3 | 35 | 48.1 | 6.6 | 15.9 | 1.4 | 27.9 | 39.7 | 23.9 | 88.3 | 11.7 | 81.4 | 6.4 | 3.2 | 1.2 | 10.8 | 11 | 0 | 0 | 0 | 2 | 8 | 58 | 9 | 12 | 0 | 2 | 12 | 7.9 | 3.76 | 1.14 | 3.29 | 0.09 | 8 | 17 | 7 | 52 |
| HAZELWOOD | 405,000 | 400,814 | 377 | 16 | 51 | 18 | 66 | 18 | 0 | 1 | 1,570 | 255 | 1972 | 1,120 | 25,518 | 6,236 | 38 | 53,590 | 48 | 18 | 5 | 27 | 37.1 | 6.8 | 12.9 | 2.8 | 40.2 | 18.5 | 8.5 | 65.9 | 34.1 | 81.6 | 2.9 | 2.3 | 1.7 | 6.9 | 690 | 3 | 30 | 25 | 109 | 189 | 1276 | 480 | 525 | 35 | 34 | 76 | 117.3 | 18.22 | 4.09 | 4.45 | 0.07 | 2 | 15 | 14 | 64 |
| HEALY HEIGHTS | 1,300,000 | 1,469,444 | 9 | 4 | 21 | 8 | 0 | 0 | 0 | 0 | 3,398 | 432 | 1965 | 1,222 | 192 | 3,270 | 42 | 103,309 | 55 | 12 | 6 | 21 | 56.8 | 6.1 | 7.5 | 1.1 | 28.4 | 34.3 | 46.2 | 83.6 | 16.4 | 85.4 | 1.9 | 4.0 | 0.9 | 6.8 | 0 | 0 | 0 | 0 | 0 | 1 | 1 | 0 | 0 | 0 | 0 | 10 | 0.0 | 0.00 | 0.06 | 0.00 | 0.00 | 3 | 13 | 1 | 13 |
| HILLSDALE | 625,000 | 665,446 | 165 | 2 | 26 | 16 | 25 | 15 | 0 | 1 | 2,283 | 291 | 1962 | 1,279 | 8,229 | 4,394 | 42 | 105,061 | 67 | 8 | 4 | 28 | 52.0 | 4.4 | 13.1 | 0.8 | 29.8 | 38.1 | 34.5 | 88.5 | 11.5 | 83.5 | 3.6 | 4.7 | 0.7 | 9.0 | 45 | 0 | 0 | 3 | 3 | 41 | 191 | 39 | 46 | 1 | 6 | 33 | 20.8 | 8.02 | 1.87 | 4.29 | 0.11 | 6 | 12 | 16 | 57 |
| HILLSIDE | 920,500 | 936,860 | 104 | 6 | 15 | 57 | 45 | 43 | 0 | 0 | 2,391 | 392 | 1972 | 1,394 | 1,306 | 1,878 | 49 | 161,987 | 82 | 4 | 2 | 25 | 64.3 | 3.9 | 8.2 | 0.1 | 23.6 | 35.1 | 45.7 | 83.5 | 16.5 | 91.5 | 1.6 | 2.8 | 1.5 | 5.9 | 3 | 0 | 0 | 0 | 0 | 6 | 58 | 8 | 17 | 0 | 2 | 55 | 11.5 | 1.10 | 0.70 | 1.58 | 0.20 | 29 | 12 | 3 | 47 |
| HOLLYWOOD | 596,450 | 684,768 | 22 | 1 | -1 | 33 | 3 | 14 | 0 | 0 | 2,419 | 283 | 1935 | 1,201 | 2,251 | 9,506 | 42 | 65,906 | 45 | 17 | 5 | 21 | 37.0 | 2.5 | 19.4 | 0.6 | 40.5 | 37.7 | 27.5 | 89.7 | 10.3 | 83.0 | 1.9 | 6.5 | 0.1 | 8.4 | 71 | 0 | 4 | 2 | 7 | 51 | 240 | 53 | 72 | 0 | 37 | 153 | 223.9 | 1.69 | 0.24 | 7.13 | 0.00 | 0 | 9 | 8 | 94 |
| HOMESTEAD | 488,000 | 469,794 | 32 | 3 | 99 | 29 | 12 | 38 | 0 | 0 | 1,529 | 307 | 1953 | 1,390 | 2,210 | 2,721 | 43 | 104,289 | 57 | 10 | 4 | 20 | 51.5 | 4.4 | 9.7 | 1.4 | 32.9 | 36.9 | 42.1 | 87.2 | 12.8 | 78.8 | 2.7 | 6.0 | 0.6 | 9.2 | 17 | 0 | 5 | 1 | 0 | 9 | 74 | 12 | 13 | 0 | 10 | 43 | 14.8 | 4.04 | 0.81 | 4.98 | 0.40 | 49 | 10 | 16 | 47 |
| HOSFORD-ABERNETHY | 675,000 | 699,395 | 140 | 0 | 15 | 14 | 19 | 14 | 0 | 0 | 2,274 | 308 | 1934 | 1,280 | 8,865 | 6,815 | 37 | 82,092 | 45 | 12 | 5 | 20 | 37.2 | 2.0 | 9.8 | 2.2 | 48.9 | 37.6 | 27.4 | 91.4 | 8.6 | 79.2 | 3.7 | 6.9 | 0.8 | 11.4 | 71 | 2 | 0 | 4 | 8 | 138 | 407 | 141 | 164 | 3 | 10 | 77 | 108.4 | 8.88 | 1.30 | 6.83 | 0.00 | 0 | 7 | 14 | 92 |
| HUMBOLDT | 600,000 | 608,187 | 97 | 9 | 20 | 15 | 19 | 20 | 0 | 0 | 2,101 | 289 | 1952 | 1,356 | 5,302 | 9,642 | 35 | 81,145 | 54 | 15 | 4 | 28 | 36.2 | 1.8 | 12.3 | 1.4 | 48.2 | 35.7 | 23.5 | 88.3 | 11.7 | 79.7 | 1.3 | 6.6 | 0.5 | 8.4 | 84 | 1 | 2 | 3 | 5 | 35 | 154 | 127 | 78 | 1 | 18 | 60 | 231.0 | 3.98 | 0.55 | 7.24 | 0.00 | 0 | 10 | 3 | 89 |
| IRVINGTON | 860,000 | 904,223 | 111 | 10 | 19 | 29 | 22 | 20 | 0 | 0 | 3,032 | 298 | 1930 | 1,559 | 5,988 | 9,203 | 43 | 101,630 | 61 | 7 | 3 | 24 | 46.6 | 3.9 | 11.0 | 1.3 | 37.1 | 37.0 | 34.2 | 90.3 | 9.7 | 79.9 | 1.8 | 5.5 | 0.4 | 7.8 | 44 | 0 | 1 | 5 | 9 | 37 | 209 | 111 | 99 | 0 | 10 | 60 | 170.6 | 3.61 | 0.65 | 5.55 | 0.03 | 4 | 11 | 5 | 84 |
| KENTON | 493,000 | 504,849 | 213 | 9 | 32 | 13 | 1 | 0 | 0 | 0 | 1,662 | 304 | 1943 | 1,526 | 7,842 | 2,283 | 42 | 74,862 | 66 | 11 | 1 | 21 | 41.8 | 2.7 | 12.6 | 2.9 | 39.9 | 27.5 | 11.5 | 78.3 | 21.7 | 83.7 | 1.5 | 2.7 | 0.1 | 4.2 | 128 | 2 | 6 | 9 | 16 | 60 | 264 | 177 | 129 | 0 | 21 | 64 | 51.5 | 14.01 | 3.43 | 4.08 | 0.19 | 6 | 14 | 6 | 73 |
| KERNS | 524,500 | 564,752 | 62 | -5 | 3 | 23 | 23 | 37 | 0 | 0 | 1,956 | 289 | 1935 | 1,248 | 6,923 | 8,375 | 34 | 54,309 | 17 | 14 | 3 | 11 | 29.4 | 1.6 | 11.6 | 2.6 | 54.7 | 44.9 | 19.2 | 88.5 | 11.5 | 74.9 | 3.6 | 5.9 | 0.1 | 9.6 | 97 | 0 | 8 | 7 | 15 | 108 | 511 | 167 | 197 | 1 | 18 | 114 | 202.1 | 4.38 | 0.83 | 5.30 | 0.03 | 3 | 9 | 17 | 94 |
| KING | 577,500 | 615,111 | 132 | 5 | 23 | 21 | 12 | 9 | 0 | 0 | 2,085 | 295 | 1946 | 1,213 | 7,168 | 11,563 | 34 | 71,505 | 49 | 18 | 6 | 25 | 34.1 | 1.7 | 9.7 | 1.5 | 53.1 | 32.3 | 23.3 | 88.6 | 11.4 | 80.0 | 2.2 | 4.9 | 0.5 | 7.7 | 114 | 0 | 8 | 4 | 12 | 36 | 172 | 115 | 108 | 0 | 19 | 45 | 185.5 | 0.91 | 0.62 | 1.46 | 0.01 | 1 | 12 | 3 | 89 |
| LAURELHURST | 835,000 | 898,047 | 105 | 2 | 16 | 23 | 1 | 1 | 0 | 1 | 3,076 | 292 | 1924 | 1,227 | 5,058 | 7,572 | 43 | 126,286 | 76 | 4 | 1 | 37 | 58.5 | 3.9 | 9.7 | 0.7 | 27.2 | 40.6 | 35.4 | 94.6 | 5.4 | 87.4 | 1.1 | 6.0 | 0.0 | 7.1 | 22 | 0 | 0 | 0 | 0 | 22 | 93 | 48 | 61 | 2 | 4 | 32 | 71.9 | 4.60 | 0.67 | 6.89 | 0.05 | 8 | 9 | 8 | 82 |
| LENTS | 395,000 | 397,877 | 357 | 14 | 55 | 18 | 13 | 4 | 2 | 1 | 1,481 | 269 | 1947 | 1,255 | 21,641 | 5,959 | 37 | 55,666 | 53 | 18 | 6 | 33 | 40.9 | 4.7 | 12.2 | 2.1 | 40.1 | 18.4 | 6.8 | 68.6 | 31.4 | 83.7 | 3.1 | 2.8 | 1.0 | 6.9 | 442 | 3 | 21 | 16 | 55 | 131 | 624 | 351 | 298 | 24 | 25 | 51 | 98.1 | 21.36 | 3.58 | 5.97 | 0.34 | 9 | 16 | 8 | 61 |
| LINNTON* | 440,000 | 489,605 | 19 | 2 | 39 | 56 | 4 | 21 | 0 | 0 | 1,884 | 260 | 1961 | 1,012 | 135 | 62 | 48 | 97,898 | 82 | 9 | 3 | 24 | 53.5 | 3.0 | 14.9 | 0.2 | 28.4 | 30.2 | 24.0 | 96.4 | 3.6 | 87.2 | 3.6 | 3.1 | 0.0 | 6.7 | 9 | 0 | 0 | 0 | 0 | 7 | 116 | 9 | 26 | 0 | 67 | 977 | 6.3 | 5.55 | 1.44 | 3.86 | 0.10 | 7 | 18 | 2 | 4 |
| LLOYD DISTRICT | 256,500 | 265,236 | 14 | 22 | 24 | 73 | 14 | 100 | 0 | 0 | 780 | 340 | 1975 | 1,370 | 2,372 | 4,632 | 38 | 55,835 | 13 | 18 | 7 | 5 | 21.2 | 6.8 | 15.2 | 1.3 | 55.5 | 39.5 | 19.8 | 90.5 | 9.5 | 65.0 | 6.5 | 11.0 | 0.3 | 17.8 | 194 | 1 | 21 | 5 | 54 | 49 | 513 | 99 | 216 | 1 | 116 | 279 | 193.4 | 7.65 | 0.51 | 14.94 | 0.00 | 1 | 10 | 16 | 91 |
| MADISON SOUTH | 433,000 | 447,700 | 123 | 11 | 36 | 20 | 8 | 7 | 0 | 0 | 1,680 | 267 | 1958 | 1,261 | 9,349 | 5,320 | 38 | 60,540 | 64 | 11 | 8 | 24 | 41.9 | 5.5 | 14.9 | 2.7 | 35.0 | 26.4 | 11.7 | 82.8 | 17.2 | 84.7 | 1.5 | 2.2 | 0.5 | 4.2 | 147 | 6 | 13 | 4 | 19 | 56 | 206 | 95 | 107 | 3 | 20 | 38 | 54.1 | 3.53 | 1.76 | 2.01 | 0.21 | 12 | 12 | 9 | 57 |
| MAPLEWOOD | 650,000 | 664,261 | 49 | 26 | 37 | 15 | 4 | 8 | 0 | 0 | 2,217 | 300 | 1965 | 2,131 | 2,538 | 4,175 | 48 | 108,185 | 80 | 3 | 4 | 26 | 62.6 | 5.9 | 13.4 | 0.3 | 17.8 | 38.3 | 32.0 | 93.7 | 6.3 | 85.4 | 5.1 | 2.6 | 0.4 | 8.1 | 11 | 0 | 0 | 0 | 0 | 5 | 22 | 5 | 5 | 0 | 4 | 13 | 8.1 | 3.71 | 0.62 | 5.99 | 0.02 | 3 | 16 | 1 | 34 |
| MARKHAM | 575,000 | 565,477 | 67 | 10 | 35 | 19 | 5 | 7 | 0 | 1 | 2,060 | 275 | 1972 | 1,624 | 1,815 | 3,496 | 42 | 129,547 | 86 | 5 | 3 | 34 | 62.3 | 2.5 | 12.1 | 0.4 | 22.6 | 42.1 | 34.3 | 92.3 | 7.7 | 86.3 | 1.7 | 1.6 | 2.4 | 5.7 | 4 | 0 | 0 | 0 | 1 | 3 | 28 | 9 | 12 | 0 | 3 | 22 | 17.3 | 0.12 | 0.52 | 0.23 | 0.01 | 3 | 13 | 4 | 42 |
| MARSHALL PARK | 632,500 | 675,476 | 36 | 10 | 17 | 16 | 0 | 0 | 0 | 0 | 2,298 | 294 | 1967 | 1,529 | 1,378 | 2,257 | 40 | 140,628 | 90 | 6 | 2 | 36 | 63.0 | 2.0 | 7.9 | 0.4 | 26.6 | 40.5 | 37.4 | 90.9 | 9.1 | 85.6 | 2.9 | 3.9 | 0.8 | 7.6 | 0 | 1 | 0 | 0 | 1 | 3 | 3 | 1 | 0 | 1 | 5 | 4.9 | 0.00 | 0.61 | 0.01 | 0.10 | 17 | 14 | 4 | 28 | |
| MILL PARK | 405,000 | 400,477 | 106 | 16 | 53 | 17 | 19 | 18 | 0 | 1 | 1,556 | 257 | 1966 | 1,171 | 8,990 | 8,884 | 34 | 50,845 | 43 | 22 | 9 | 30 | 40.8 | 4.9 | 10.9 | 1.9 | 41.6 | 13.2 | 6.4 | 53.9 | 46.1 | 83.2 | 2.2 | 2.5 | 2.3 | 7.0 | 182 | 1 | 8 | 6 | 18 | 72 | 183 | 86 | 125 | 7 | 24 | 38 | 85.0 | 2.95 | 1.01 | 2.92 | 0.02 | 2 | 18 | 4 | 70 |
| MONTAVILLA | 445,000 | 453,673 | 333 | 9 | 36 | 17 | 18 | 5 | 0 | 0 | 1,558 | 291 | 1953 | 1,197 | 16,604 | 7,621 | 38 | 62,700 | 60 | 14 | 6 | 24 | 41.3 | 5.1 | 13.0 | 1.4 | 39.3 | 27.9 | 14.6 | 77.9 | 22.1 | 82.8 | 1.5 | 5.1 | 0.2 | 6.9 | 237 | 1 | 14 | 11 | 34 | 147 | 485 | 260 | 243 | 9 | 18 | 54 | 119.4 | 7.73 | 2.18 | 3.55 | 0.03 | 1 | 14 | 9 | 76 |
| MT SCOTT-ARLETA | 465,000 | 469,126 | 175 | 15 | 37 | 18 | 9 | 5 | 0 | 1 | 1,550 | 303 | 1950 | 1,275 | 8,035 | 9,301 | 36 | 70,008 | 62 | 12 | 5 | 29 | 40.7 | 4.4 | 13.1 | 0.9 | 40.8 | 28.3 | 14.6 | 81.7 | 18.3 | 80.9 | 3.0 | 4.4 | 0.8 | 8.2 | 103 | 1 | 4 | 7 | 14 | 35 | 144 | 107 | 84 | 4 | 16 | 36 | 123.9 | 2.52 | 0.86 | 2.92 | 0.02 | 2 | 16 | 5 | 80 |
| MT TABOR | 687,000 | 766,341 | 189 | 14 | 28 | 22 | 8 | 4 | 0 | 0 | 2,507 | 306 | 1945 | 1,272 | 11,883 | 7,434 | 41 | 81,267 | 61 | 10 | 5 | 25 | 44.3 | 5.4 | 12.3 | 0.8 | 37.2 | 32.4 | 23.3 | 88.7 | 11.3 | 86.7 | 1.6 | 4.9 | 0.6 | 7.0 | 33 | 0 | 2 | 0 | 4 | 38 | 269 | 98 | 80 | 0 | 3 | 34 | 61.3 | 7.40 | 1.60 | 4.63 | 0.28 | 17 | 14 | 5 | 69 |
| MULTNOMAH | 545,000 | 559,214 | 158 | 17 | 39 | 21 | 45 | 28 | 0 | 0 | 1,875 | 298 | 1961 | 1,236 | 8,837 | 6,124 | 36 | 75,846 | 54 | 10 | 6 | 25 | 39.8 | 2.6 | 13.1 | 0.3 | 44.1 | 36.2 | 29.1 | 89.0 | 11.0 | 75.4 | 7.2 | 5.1 | 1.0 | 13.2 | 63 | 0 | 3 | 1 | 5 | 39 | 175 | 49 | 57 | 0 | 8 | 30 | 34.0 | 7.29 | 1.44 | 5.05 | 0.16 | 11 | 12 | 10 | 70 |
| NORTH TABOR | 542,200 | 580,186 | 93 | 10 | 29 | 18 | 6 | 6 | 0 | 0 | 2,006 | 289 | 1922 | 1,115 | 5,764 | 9,848 | 38 | 68,449 | 41 | 13 | 4 | 18 | 34.8 | 2.0 | 12.5 | 0.8 | 49.9 | 31.2 | 18.9 | 85.7 | 14.3 | 80.0 | 2.8 | 4.4 | 0.3 | 7.5 | 66 | 1 | 6 | 3 | 5 | 28 | 262 | 91 | 81 | 1 | 14 | 66 | 155.5 | 2.10 | 0.59 | 3.58 | 0.00 | 1 | 10 | 4 | 77 |
| NORTHWEST DISTRICT | 550,000 | 644,718 | 266 | 11 | -1 | 41 | 183 | 69 | 0 | 1 | 1,655 | 389 | 1940 | 1,434 | 17,096 | 11,742 | 37 | 81,340 | 32 | 8 | 3 | 11 | 34.5 | 1.9 | 14.5 | 1.0 | 48.4 | 40.2 | 33.8 | 90.1 | 10.1 | 71.2 | 5.4 | 5.6 | 1.8 | 12.9 | 289 | 1 | 16 | 16 | 24 | 337 | 1035 | 273 | 541 | 11 | 20 | 96 | 186.6 | 10.77 | 1.46 | 7.36 | 0.03 | 2 | 7 | 8 | 93 |
| NORTHWEST HEIGHTS | 810,000 | 855,660 | 211 | 14 | 28 | 25 | 41 | 19 | 0 | 1 | 3,109 | 275 | 2000 | 1,752 | 765 | 590 | 46 | 165,976 | 83 | 3 | 2 | 35 | 66.9 | 2.6 | 7.8 | 0.0 | 22.7 | 35.6 | 44.1 | 77.1 | 22.9 | 90.2 | 3.6 | 3.0 | 1.6 | 8.2 | 3 | 0 | 0 | 0 | 0 | 3 | 15 | 1 | 0 | 4 | 25 | 0.7 | 0.00 | 1.37 | 0.00 | 0.00 | 0 | 18 | 0 | 12 | |
| OLD TOWN-CHINATOWN | 270,000 | 298,301 | 30 | 8 | 1 | 95 | 29 | 97 | 0 | 2 | 849 | 352 | 1984 | 935 | 3,942 | 14,042 | 50 | 34,351 | 22 | 23 | 6 | 2 | 26.8 | 2.6 | 21.5 | 3.7 | 45.3 | 34.9 | 18.6 | 87.5 | 12.5 | 66.7 | 5.2 | 7.5 | 3.5 | 16.2 | 398 | 7 | 24 | 30 | 38 | 71 | 256 | 58 | 242 | 66 | 126 | 98 | 206.6 | 4.74 | 0.28 | 16.87 | 0.02 | 6 | 4 | 26 | 97 |
| OVERLOOK | 576,500 | 576,850 | 164 | 16 | 22 | 24 | 43 | 26 | 1 | 0 | 1,906 | 303 | 1957 | 1,631 | 7,406 | 7,191 | 42 | 97,640 | 61 | 12 | 5 | 27 | 46.4 | 3.2 | 13.1 | 0.9 | 54.1 | 46.2 | 24.3 | 83.7 | 16.4 | 78.3 | 0.7 | 6.8 | 1.1 | 8.5 | 80 | 1 | 3 | 12 | 19 | 62 | 373 | 174 | 127 | 5 | 16 | 82 | 54.6 | 11.31 | 3.18 | 3.55 | 0.13 | 4 | 10 | 6 | 74 |
| PARKROSE | 403,000 | 409,993 | 72 | 15 | 47 | 21 | 0 | 0 | 0 | 0 | 1,810 | 227 | 1951 | 908 | 5,360 | 2,667 | 39 | 52,605 | 48 | 23 | 6 | 24 | 25.9 | 3.3 | 18.0 | 4.2 | 48.6 | 12.0 | 4.7 | 81.1 | 18.9 | 64.8 | 16.5 | 6.5 | 0.2 | 23.2 | 197 | 5 | 14 | 15 | 39 | 80 | 511 | 291 | 196 | 2 | 50 | 165 | 144.8 | 8.18 | 2.01 | 4.07 | 0.00 | 0 | 16 | 7 | 56 |
| PARKROSE HEIGHTS | 422,000 | 427,866 | 109 | 17 | 53 | 12 | 0 | 0 | 0 | 0 | 1,576 | 271 | 1955 | 1,071 | 5,656 | 5,808 | 40 | 61,451 | 62 | 9 | 4 | 28 | 40.3 | 8.8 | 13.7 | 1.6 | 35.7 | 17.9 | 9.2 | 79.5 | 20.5 | 84.7 | 1.5 | 4.2 | 0.5 | 6.2 | 63 | 1 | 3 | 3 | 10 | 44 | 97 | 70 | 72 | 2 | 14 | 37 | 71.9 | 3.41 | 0.97 | 3.50 | 0.02 | 2 | 14 | 6 | 60 |
| PEARL | 494,250 | 621,578 | 330 | 10 | -3 | 71 | 330 | 100 | 0 | 2 | 1,180 | 527 | 1980 | 1,277 | 6,712 | 15,066 | 46 | 59,242 | 25 | 16 | 5 | 3 | 29.4 | 1.9 | 18.8 | 2.5 | 47.4 | 41.3 | 25.2 | 87.9 | 12.1 | 66.4 | 4.3 | 8.2 | 3.9 | 16.3 | 209 | 0 | 8 | 8 | 23 | 211 | 897 | 110 | 371 | 25 | 37 | 181 | 247.0 | 4.75 | 0.45 | 10.66 | 0.01 | 3 | 6 | 15 | 98 |
| PIEDMONT | 515,000 | 534,498 | 171 | 14 | 26 | 19 | 14 | 8 | 0 | 0 | 1,997 | 268 | 1948 | 1,201 | 7,624 | 7,910 | 39 | 70,294 | 57 | 13 | 4 | 22 | 35.5 | 5.1 | 10.5 | 2.3 | 46.6 | 35.2 | 17.1 | 85.0 | 15.0 | 86.4 | 1.4 | 3.5 | 0.3 | 5.1 | 89 | 2 | 5 | 11 | 9 | 30 | 197 | 170 | 92 | 1 | 15 | 52 | 176.4 | 5.61 | 0.96 | 5.82 | 0.05 | 5 | 12 | 5 | 73 |
| PLEASANT VALLEY* | 485,000 | 495,545 | 221 | 8 | 31 | 23 | 19 | 9 | 0 | 0 | 2,197 | 226 | 1992 | 1,385 | 12,229 | 2,021 | 39 | 76,699 | 79 | 12 | 5 | 37 | 55.6 | 4.0 | 8.7 | 1.6 | 30.1 | 17.0 | 10.8 | 64.1 | 35.9 | 85.8 | 4.9 | 1.7 | 1.8 | 8.4 | 79 | 1 | 5 | 3 | 3 | 27 | 129 | 54 | 42 | 0 | 7 | 17 | 12.3 | 6.29 | 4.40 | 1.43 | 1.65 | 38 | 23 | 3 | 22 |
| PORTSMOUTH | 467,500 | 472,774 | 187 | 14 | 43 | 13 | 3 | 2 | 0 | 1 | 1,551 | 305 | 1964 | 1,204 | 11,020 | 10,129 | 33 | 61,730 | 60 | 25 | 4 | 33 | 36.6 | 2.9 | 11.6 | 1.8 | 47.0 | 26.8 | 9.7 | 72.0 | 28.0 | 79.2 | 1.1 | 2.8 | 0.0 | 3.9 | 152 | 4 | 9 | 5 | 11 | 32 | 163 | 128 | 77 | 0 | 16 | 29 | 117.7 | 8.65 | 1.09 | 7.95 | 0.10 | 9 | 16 | 3 | 62 |
| POWELLHURST GILBERT | 380,000 | 368,403 | 401 | 19 | 55 | 24 | 78 | 19 | 0 | 2 | 1,504 | 245 | 1974 | 1,168 | 26,067 | 7,589 | 36 | 47,549 | 53 | 22 | 8 | 37 | 41.1 | 4.1 | 10.9 | 2.6 | 41.3 | 11.7 | 5.8 | 59.3 | 40.7 | 86.4 | 2.1 | 2.5 | 1.3 | 5.9 | 466 | 3 | 18 | 20 | 55 | 143 | 473 | 271 | 271 | 25 | 22 | 34 | 78.9 | 15.24 | 3.43 | 4.44 | 0.22 | 6 | 18 | 7 | 54 |
| REED | 588,625 | 651,536 | 58 | 6 | 21 | 16 | 0 | 0 | 0 | 0 | 2,164 | 301 | 1957 | 1,351 | 2,972 | 6,438 | 30 | 63,966 | 41 | 14 | 5 | 17 | 31.9 | 5.3 | 6.8 | 0.5 | 55.5 | 29.1 | 24.7 | 86.8 | 13.2 | 68.2 | 4.2 | 10.4 | 1.6 | 16.2 | 40 | 0 | 0 | 2 | 5 | 28 | 137 | 59 | 42 | 0 | 16 | 75 | 127.8 | 0.88 | 0.46 | 1.91 | 0.00 | 0 | 12 | 3 | 61 |
| RICHMOND | 620,000 | 637,716 | 264 | 3 | 20 | 19 | 37 | 14 | 0 | 0 | 2,070 | 308 | 1938 | 1,479 | 13,836 | 10,878 | 36 | 84,810 | 54 | 10 | 4 | 24 | 42.5 | 2.6 | 9.5 | 0.8 | 44.7 | 38.0 | 28.3 | 90.5 | 9.5 | 80.3 | 2.5 | 5.0 | 1.6 | 9.0 | 91 | 0 | 1 | 8 | 16 | 131 | 510 | 146 | 178 | 1 | 8 | 57 | 114.8 | 4.43 | 1.27 | 3.48 | 0.01 | 1 | 12 | 6 | 91 |
| ROSE CITY PARK | 647,500 | 655,843 | 198 | 13 | 26 | 17 | 6 | 3 | 0 | 1 | 2,319 | 283 | 1928 | 1,148 | 10,388 | 8,678 | 42 | 91,597 | 71 | 6 | 4 | 27 | 47.0 | 3.1 | 15.8 | 0.9 | 33.2 | 36.8 | 25.0 | 87.9 | 12.1 | 87.4 | 1.5 | 3.3 | 0.3 | 5.1 | 56 | 1 | 5 | 2 | 8 | 57 | 236 | 103 | 55 | 1 | 7 | 38 | 86.0 | 5.39 | 1.20 | 4.50 | 0.04 | 3 | 11 | 7 | 78 |
| ROSEWAY | 525,000 | 517,504 | 164 | 14 | 31 | 11 | 0 | 0 | 0 | 1 | 1,773 | 292 | 1941 | 1,326 | 5,877 | 6,980 | 40 | 75,753 | 72 | 6 | 4 | 24 | 49.8 | 1.9 | 17.3 | 1.4 | 29.6 | 29.6 | 20.7 | 84.9 | 15.1 | 86.2 | 1.4 | 2.5 | 0.5 | 4.4 | 38 | 0 | 0 | 0 | 13 | 40 | 188 | 108 | 52 | 2 | 9 | 57 | 128.3 | 1.70 | 0.84 | 2.01 | 0.01 | 2 | 16 | 4 | 78 |
| RUSSELL | 440,000 | 444,832 | 66 | 10 | 47 | 11 | 0 | 0 | 0 | 0 | 1,717 | 259 | 1960 | 1,261 | 3,706 | 4,639 | 49 | 65,144 | 85 | 11 | 7 | 22 | 52.3 | 11.9 | 12.0 | 0.7 | 23.1 | 19.6 | 8.7 | 81.9 | 18.1 | 86.8 | 1.6 | 3.1 | 0.3 | 5.0 | 37 | 1 | 5 | 3 | 12 | 10 | 97 | 59 | 30 | 3 | 16 | 45 | 73.9 | 4.50 | 0.80 | 5.64 | 0.02 | 3 | 18 | 3 | 38 |
| SABIN | 685,750 | 716,561 | 104 | 0 | 28 | 15 | 2 | 2 | 0 | 0 | 2,363 | 303 | 1932 | 1,425 | 4,934 | 10,483 | 39 | 103,603 | 68 | 7 | 4 | 29 | 43.4 | 2.9 | 10.7 | 1.0 | 41.9 | 33.8 | 35.0 | 90.9 | 9.1 | 83.9 | 1.4 | 4.4 | 0.3 | 6.1 | 8 | 0 | 1 | 0 | 2 | 9 | 104 | 62 | 15 | 0 | 2 | 35 | 131.8 | 1.30 | 0.47 | 2.76 | 0.00 | 1 | 14 | 2 | 83 |
| SELLWOOD-MORELAND | 640,000 | 675,520 | 266 | 12 | 31 | 20 | 36 | 14 | 1 | 2 | 2,044 | 330 | 1947 | 1,146 | 8,760 | 4,334 | 42 | 82,793 | 56 | 10 | 5 | 26 | 49.9 | 4.2 | 16.2 | 1.3 | 28.4 | 36.5 | 27.2 | 91.6 | 8.4 | 81.3 | 6.7 | 5.7 | 0.7 | 13.0 | 104 | 3 | 4 | 3 | 6 | 82 | 368 | 114 | 126 | 2 | 14 | 64 | 54.8 | 9.14 | 2.08 | 4.39 | 0.49 | 23 | 13 | 6 | 81 |
| SOUTH BURLINGAME | 589,900 | 596,498 | 47 | 3 | 28 | 19 | 0 | 0 | 0 | 0 | 2,211 | 270 | 1950 | 1,765 | 1,985 | 4,670 | 41 | 111,195 | 78 | 5 | 4 | 29 | 53.6 | 3.0 | 15.4 | 0.4 | 27.6 | 41.8 | 31.6 | 92.3 | 7.7 | 83.7 | 1.7 | 1.4 | 4.5 | 7.6 | 2 | 0 | 2 | 1 | 0 | 6 | 20 | 6 | 12 | 0 | 3 | 16 | 14.1 | 1.75 | 0.43 | 4.11 | 0.02 | 5 | 10 | 8 | 63 |
| SOUTH PORTLAND | 510,000 | 583,336 | 277 | 10 | 20 | 44 | 164 | 59 | 0 | 0 | 1,677 | 348 | 1979 | 1,650 | 11,212 | 6,584 | 38 | 90,059 | 38 | 11 | 4 | 9 | 38.1 | 5.7 | 14.2 | 0.3 | 41.7 | 38.4 | 36.3 | 84.9 | 15.1 | 71.0 | 6.4 | 6.4 | 1.0 | 13.8 | 70 | 1 | 5 | 4 | 6 | 69 | 380 | 104 | 154 | 2 | 8 | 49 | 61.1 | 11.06 | 1.70 | 6.49 | 0.10 | 6 | 9 | 26 | 72 |
| SOUTH TABOR | 562,000 | 562,945 | 126 | 17 | 35 | 11 | 6 | 5 | 0 | 0 | 1,892 | 298 | 1949 | 1,219 | 6,839 | 8,557 | 37 | 69,222 | 62 | 9 | 4 | 24 | 43.2 | 1.9 | 12.5 | 1.8 | 40.6 | 33.2 | 18.8 | 85.2 | 14.8 | 81.0 | 2.9 | 3.4 | 0.8 | 7.2 | 78 | 0 | 4 | 2 | 21 | 69 | 210 | 94 | 60 | 0 | 15 | 55 | 117.6 | 3.75 | 0.80 | 4.70 | 0.02 | 2 | 15 | 4 | 76 |
| SOUTHWEST HILLS* | 999,975 | 1,158,257 | 202 | 18 | 27 | 48 | 23 | 11 | 0 | 0 | 3,369 | 344 | 1949 | 1,695 | 6,967 | 2,875 | 45 | 140,192 | 74 | 7 | 4 | 28 | 63.9 | 3.9 | 7.7 | 0.8 | 23.7 | 37.5 | 41.8 | 86.9 | 13.1 | 86.1 | 2.8 | 4.5 | 0.7 | 8.0 | 15 | 0 | 1 | 1 | 2 | 27 | 108 | 24 | 43 | 1 | 3 | 23 | 12.4 | 1.71 | 1.94 | 0.88 | 0.26 | 14 | 8 | 7 | 32 |
| ST. JOHNS | 450,000 | 451,195 | 286 | 13 | 45 | 17 | 33 | 12 | 0 | 0 | 1,456 | 310 | 1953 | 1,451 | 13,946 | 1,266 | 40 | 70,968 | 61 | 12 | 4 | 22 | 39.8 | 2.7 | 12.2 | 3.0 | 42.1 | 26.5 | 10.5 | 78.0 | 22.0 | 83.1 | 1.7 | 3.5 | 0.2 | 5.3 | 182 | 3 | 10 | 1 | 26 | 67 | 297 | 195 | 161 | 1 | 16 | 40 | 17.7 | 19.59 | 11.01 | 1.78 | 3.41 | 31 | 18 | 5 | 63 |
| SULLIVAN'S GULCH | 335,000 | 454,800 | 47 | -22 | -4 | 46 | 34 | 72 | 0 | 0 | 1,484 | 307 | 1966 | 1,285 | 3,417 | 10,710 | 39 | 66,970 | 32 | 10 | 4 | 12 | 34.8 | 2.1 | 11.2 | 1.4 | 50.5 | 44.0 | 25.2 | 90.3 | 9.7 | 71.1 | 2.8 | 5.7 | 0.4 | 8.9 | 41 | 4 | 2 | 4 | 15 | 58 | 249 | 93 | 69 | 0 | 19 | 117 | 291.5 | 2.99 | 0.32 | 9.39 | 0.01 | 2 | 12 | 7 | 81 |
| SUMNER* | 390,000 | 381,044 | 43 | 16 | 40 | 30 | 0 | 0 | 0 | 1 | 1,364 | 279 | 1940 | 1,044 | 2,017 | 2,550 | 40 | 52,033 | 61 | 22 | 5 | 24 | 30.5 | 3.0 | 18.3 | 2.8 | 45.4 | 12.0 | 6.5 | 76.5 | 23.5 | 68.6 | 14.6 | 5.2 | 0.1 | 19.9 | 43 | 0 | 1 | 0 | 10 | 15 | 84 | 61 | 35 | 2 | 27 | 79 | 77.1 | 0.83 | 0.79 | 1.05 | 0.02 | 3 | 16 | 5 | 65 |
| SUNDERLAND | - | - | - | - | - | 0 | - | - | - | 1,047 | 278 | 149 | 41 | 56,001 | 50 | 25 | 5 | 21 | 23.3 | 3.2 | 19.2 | 4.2 | 50.1 | 11.5 | 4.2 | 79.6 | 20.4 | 60.2 | 20.5 | 6.3 | 0.0 | 26.8 | 38 | 0 | 3 | 4 | 4 | 54 | 81 | 38 | 33 | 0 | 176 | 621 | 20.4 | 3.71 | 1.86 | 1.99 | 0.09 | 5 | 16 | 3 | 12 | ||||
| SUNNYSIDE | 575,000 | 586,419 | 112 | 4 | 26 | 20 | 25 | 22 | 0 | 0 | 1,921 | 305 | 1935 | 1,420 | 8,049 | 13,470 | 36 | 79,553 | 40 | 11 | 3 | 19 | 34.3 | 3.1 | 11.1 | 0.7 | 50.8 | 38.7 | 25.2 | 91.9 | 8.1 | 75.2 | 2.3 | 7.3 | 0.4 | 10.0 | 77 | 0 | 2 | 8 | 10 | 84 | 313 | 132 | 124 | 0 | 12 | 66 | 220.9 | 2.13 | 0.60 | 3.57 | 0.00 | 0 | 11 | 4 | 93 |
| SYLVAN HIGHLANDS* | 819,000 | 822,092 | 31 | 17 | 29 | 31 | 4 | 13 | 0 | 0 | 2,592 | 317 | 1974 | 2,061 | 1,203 | 1,289 | 49 | 162,361 | 91 | 2 | 1 | 33 | 71.2 | 3.0 | 8.9 | 0.3 | 16.7 | 38.2 | 38.7 | 88.9 | 11.1 | 88.8 | 3.8 | 5.1 | 0.1 | 9.0 | 11 | 0 | 1 | 1 | 0 | 10 | 67 | 10 | 25 | 0 | 11 | 72 | 13.2 | 1.95 | 0.76 | 2.58 | 0.11 | 15 | 10 | 5 | 19 |
| UNIVERSITY PARK | 560,000 | 577,290 | 133 | 7 | 30 | 14 | 0 | 0 | 0 | 0 | 2,032 | 284 | 1953 | 1,495 | 6,925 | 5,409 | 23 | 79,541 | 65 | 19 | 9 | 27 | 27.3 | 2.3 | 7.9 | 0.4 | 59.2 | 32.3 | 25.2 | 84.9 | 12.2 | 71.8 | 3.8 | 10.2 | 1.4 | 15.5 | 33 | 0 | 3 | 1 | 5 | 29 | 107 | 61 | 63 | 0 | 6 | 28 | 46.2 | 4.43 | 1.32 | 3.35 | 0.04 | 3 | 16 | 3 | 54 |
| VERNON | 635,000 | 618,048 | 75 | 5 | 30 | 19 | 10 | 13 | 0 | 0 | 2,056 | 301 | 1939 | 1,520 | 2,870 | 9,258 | 36 | 95,408 | 67 | 10 | 5 | 29 | 39.2 | 2.2 | 10.7 | 0.8 | 47.2 | 34.5 | 27.8 | 92.8 | 7.2 | 85.1 | 1.6 | 5.0 | 0.5 | 7.1 | 26 | 0 | 1 | 0 | 0 | 14 | 60 | 36 | 21 | 0 | 9 | 38 | 116.1 | 0.65 | 0.31 | 2.08 | 0.03 | 8 | 14 | 2 | 90 |
| WEST PORTLAND PARK | 479,900 | 438,217 | 85 | 6 | 18 | 18 | 23 | 27 | 0 | 0 | 1,548 | 283 | 1976 | 1,317 | 4,096 | 5,615 | 36 | 71,848 | 56 | 10 | 1 | 26 | 49.9 | 2.3 | 14.6 | 2.1 | 31.1 | 34.7 | 14.8 | 79.1 | 20.9 | 83.9 | 5.6 | 2.9 | 3.3 | 11.8 | 22 | 0 | 0 | 0 | 2 | 9 | 52 | 18 | 22 | 0 | 6 | 19 | 24.7 | 2.22 | 0.73 | 3.04 | 0.06 | 8 | 14 | 7 | 57 |
| WILKES | 435,000 | 424,887 | 195 | 16 | 48 | 26 | 38 | 19 | 0 | 1 | 1,774 | 240 | 1980 | 1,227 | 9,150 | 2,968 | 43 | 64,411 | 73 | 11 | 6 | 28 | 51.4 | 6.5 | 14.6 | 2.8 | 24.8 | 15.5 | 8.9 | 72.2 | 27.8 | 89.2 | 1.8 | 2.3 | 0.3 | 4.4 | 136 | 0 | 3 | 4 | 6 | 44 | 187 | 133 | 84 | 3 | 16 | 40 | 43.2 | 11.85 | 3.08 | 3.85 | 0.31 | 10 | 19 | 6 | 30 |
| WOODLAND PARK | 430,000 | 420,400 | 5 | 12 | 42 | 9 | 0 | 0 | 0 | 0 | 1,730 | 243 | 1945 | 1,173 | 283 | 5,894 | 39 | 60,460 | 49 | 9 | 6 | 25 | 36.1 | 8.3 | 11.1 | 1.6 | 43.0 | 18.4 | 10.6 | 82.3 | 17.7 | 81.9 | 2.7 | 6.6 | 0.4 | 9.8 | 9 | 0 | 0 | 1 | 0 | 0 | 9 | 6 | 8 | 1 | 35 | 53 | 125.0 | 0.18 | 0.05 | 3.83 | 0.00 | 0 | 13 | 5 | 69 |
| WOODLAWN | 544,200 | 541,928 | 136 | 12 | 30 | 17 | 21 | 15 | 1 | 0 | 1,807 | 300 | 1965 | 1,600 | 5,842 | 7,977 | 36 | 88,850 | 70 | 13 | 5 | 27 | 36.1 | 2.3 | 10.8 | 0.8 | 50.1 | 33.5 | 22.8 | 91.6 | 8.4 | 84.2 | 2.2 | 4.6 | 0.7 | 7.5 | 44 | 2 | 1 | 2 | 2 | 25 | 136 | 67 | 47 | 1 | 9 | 39 | 91.5 | 2.75 | 0.73 | 3.76 | 0.01 | 2 | 14 | 4 | 74 |
| WOODSTOCK | 550,000 | 579,205 | 224 | 11 | 29 | 19 | 2 | 1 | 1 | 0 | 1,866 | 310 | 1954 | 1,575 | 8,866 | 7,111 | 39 | 93,152 | 73 | 6 | 4 | 30 | 52.5 | 4.3 | 11.6 | 0.7 | 30.9 | 32.9 | 26.9 | 87.7 | 12.3 | 82.3 | 3.1 | 5.5 | 0.9 | 9.5 | 52 | 0 | 3 | 6 | 14 | 76 | 216 | 88 | 59 | 5 | 8 | 43 | 70.6 | 3.87 | 1.25 | 3.10 | 0.02 | 2 | 14 | 5 | 74 |
| PORTLAND TOTAL | 510,000 | 574,526 | 12,103 | 10 | 34 | 25 | 2191 | 18 | 8 | 27 | 1913 | 320 | 1957 | 1,248 | 653,467 | 4,506 | 37 | 76,231 | 54 | 14 | 4 | 24 | 39.7 | 10.8 | 3.1 | 1.1 | 36.2 | 31.4 | 21.4 | 76.9 | 23.1 | 81.7 | 7.1 | 4.3 | 0.6 | 11.9 | 9,483 | 88 | 576 | 459 | 1,224 | 4,984 | 24,160 | 9,208 | 9,774 | 368 | 18 | 59 | 63.5 | 460.52 | 145.09 | 3.17 | 20.19 | 14 | - | 66 | 67 |
Methodology
Neighborhood Boundaries represent records maintained by the city as of January 2022. Boundary conflicts were resolved for statistical purposes only. Due to overlap between certain neighborhoods, boundary definitions may vary occasionally across categories. With the exception of the area unofficially (but universally) known as Dunthorpe, unclaimed sections of Multnomah County were excluded. *Neighborhood boundary extends beyond city limits; only data within city limits calculated.
Real Estate 2021 data from the Regional Multiple Listing Service with analysis by the Center for Spatial Analysis and Research at Portland State University’s Department of Geography. Figures were rounded for legibility. In neighborhoods with very few home sales, such as Woodland Park and Healy Heights, the year-to-year change can appear exaggerated.
People Data for demographics columns and rent costs from the US Census Bureau’s American Community Survey 5-Year Estimates, released December 2020. The ACS data are estimates only and accuracy varies by attribute.
Rent Costs Calculated from all renter-occupied units, estimated median rent is not adjusted for unit size or number of occupants. Figure includes estimated monthly utility costs.
Median Income The Census defines household as including “all the persons who occupy a housing unit as their usual place of residence.” Thus living situations in this estimate range from individuals to large households.
Crime Portland neighborhood crime data sourced from the Portland Police Bureau. Not all types of crimes are included, and figures here are for comparative purposes only. Assault includes simple and aggravated assault. Larceny includes shoplifting, theft from motor vehicle, and theft of motor vehicle parts or accessories. Assault, arson, homicide, sex offenses, and robbery are included in the violent-crimes-per-1,000 figure. Many factors can influence crimes-per-1,000 figures and can sometimes complicate meaningful neighborhood comparisons (e.g., commercial districts, or neighborhoods with high traffic and low population density).
Parks Data from Metro and/or individual cities.
Transit Data from TriMet.
Minutes by Car to Downtown Google Maps estimate, based on February 2022 non-rush-hour conditions, from a neighborhood central point to Portland’s Pioneer Courthouse Square.
Walk Score 2022 data from WalkScore.com, now a part of real estate agency Redfin. This score reflects, on a scale of 1 to 100, a neighborhood’s pedestrian-friendliness based on distances to amenities such as grocery stores and other routine destinations. For some cities and neighborhoods with a commercial central point or a large nonresidential area (such as Forest Park), the score was taken from a point in a central residential portion.
Unavailable Data is noted with a dash (—).
Real estate and other analysis by David Banis, Marty Marquis, and Elizabeth Martin of PSU’s Center for Spatial Analysis and Research. Additional research by Shannon Daehnke, Karly Quadros, Margaret Seiler, and Julia Silverman.