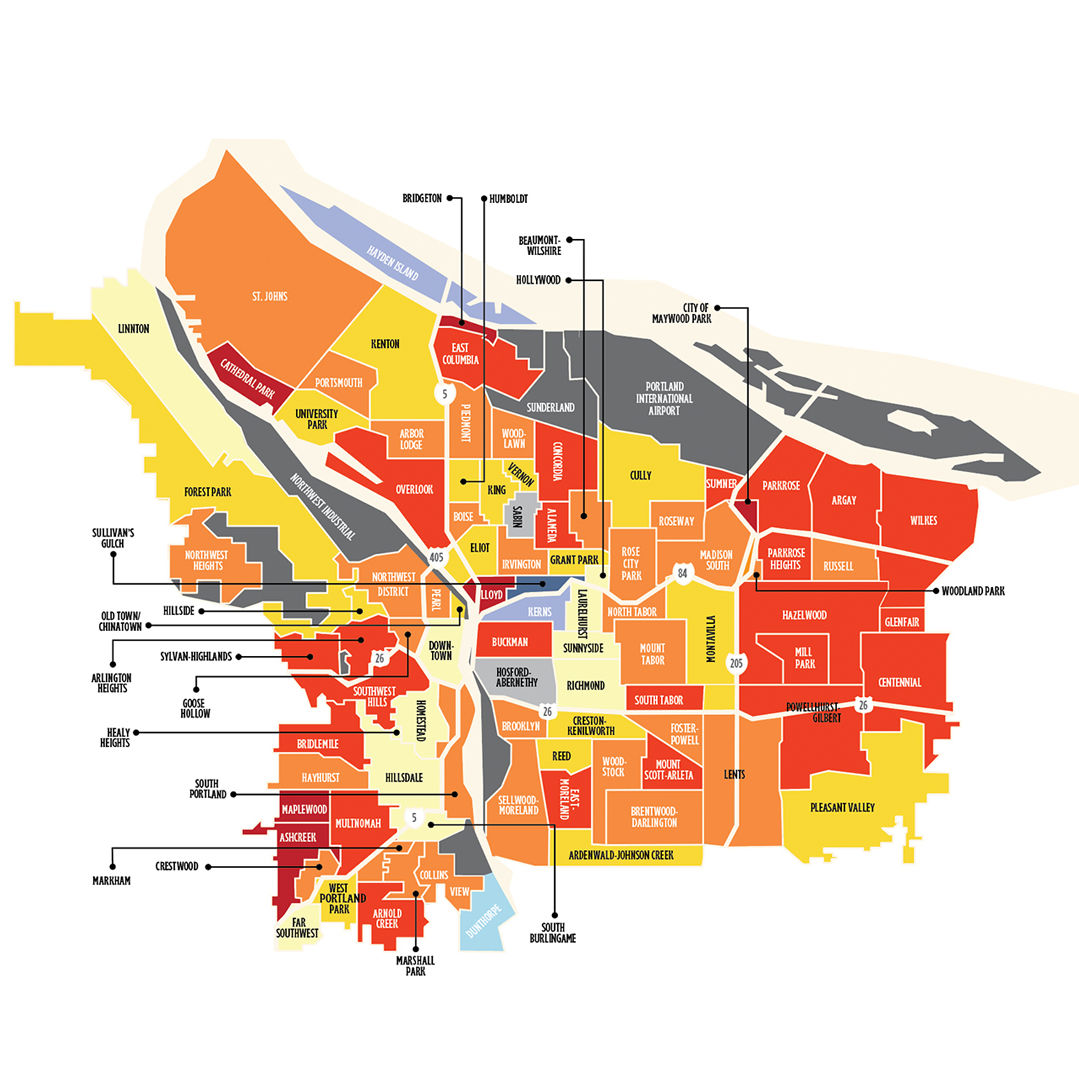
Portland Suburbs by the Numbers 2022
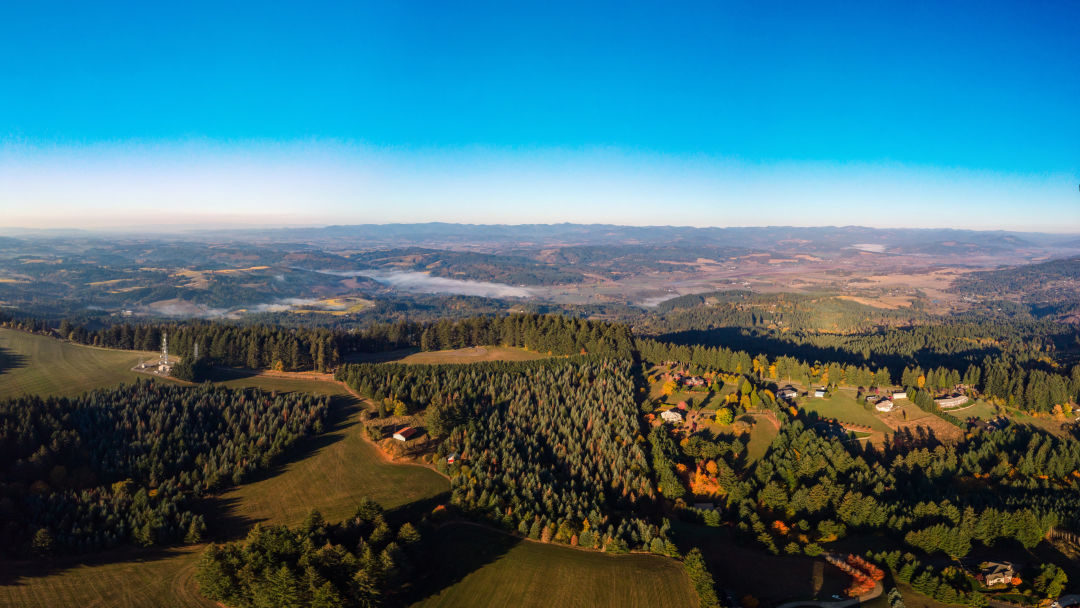
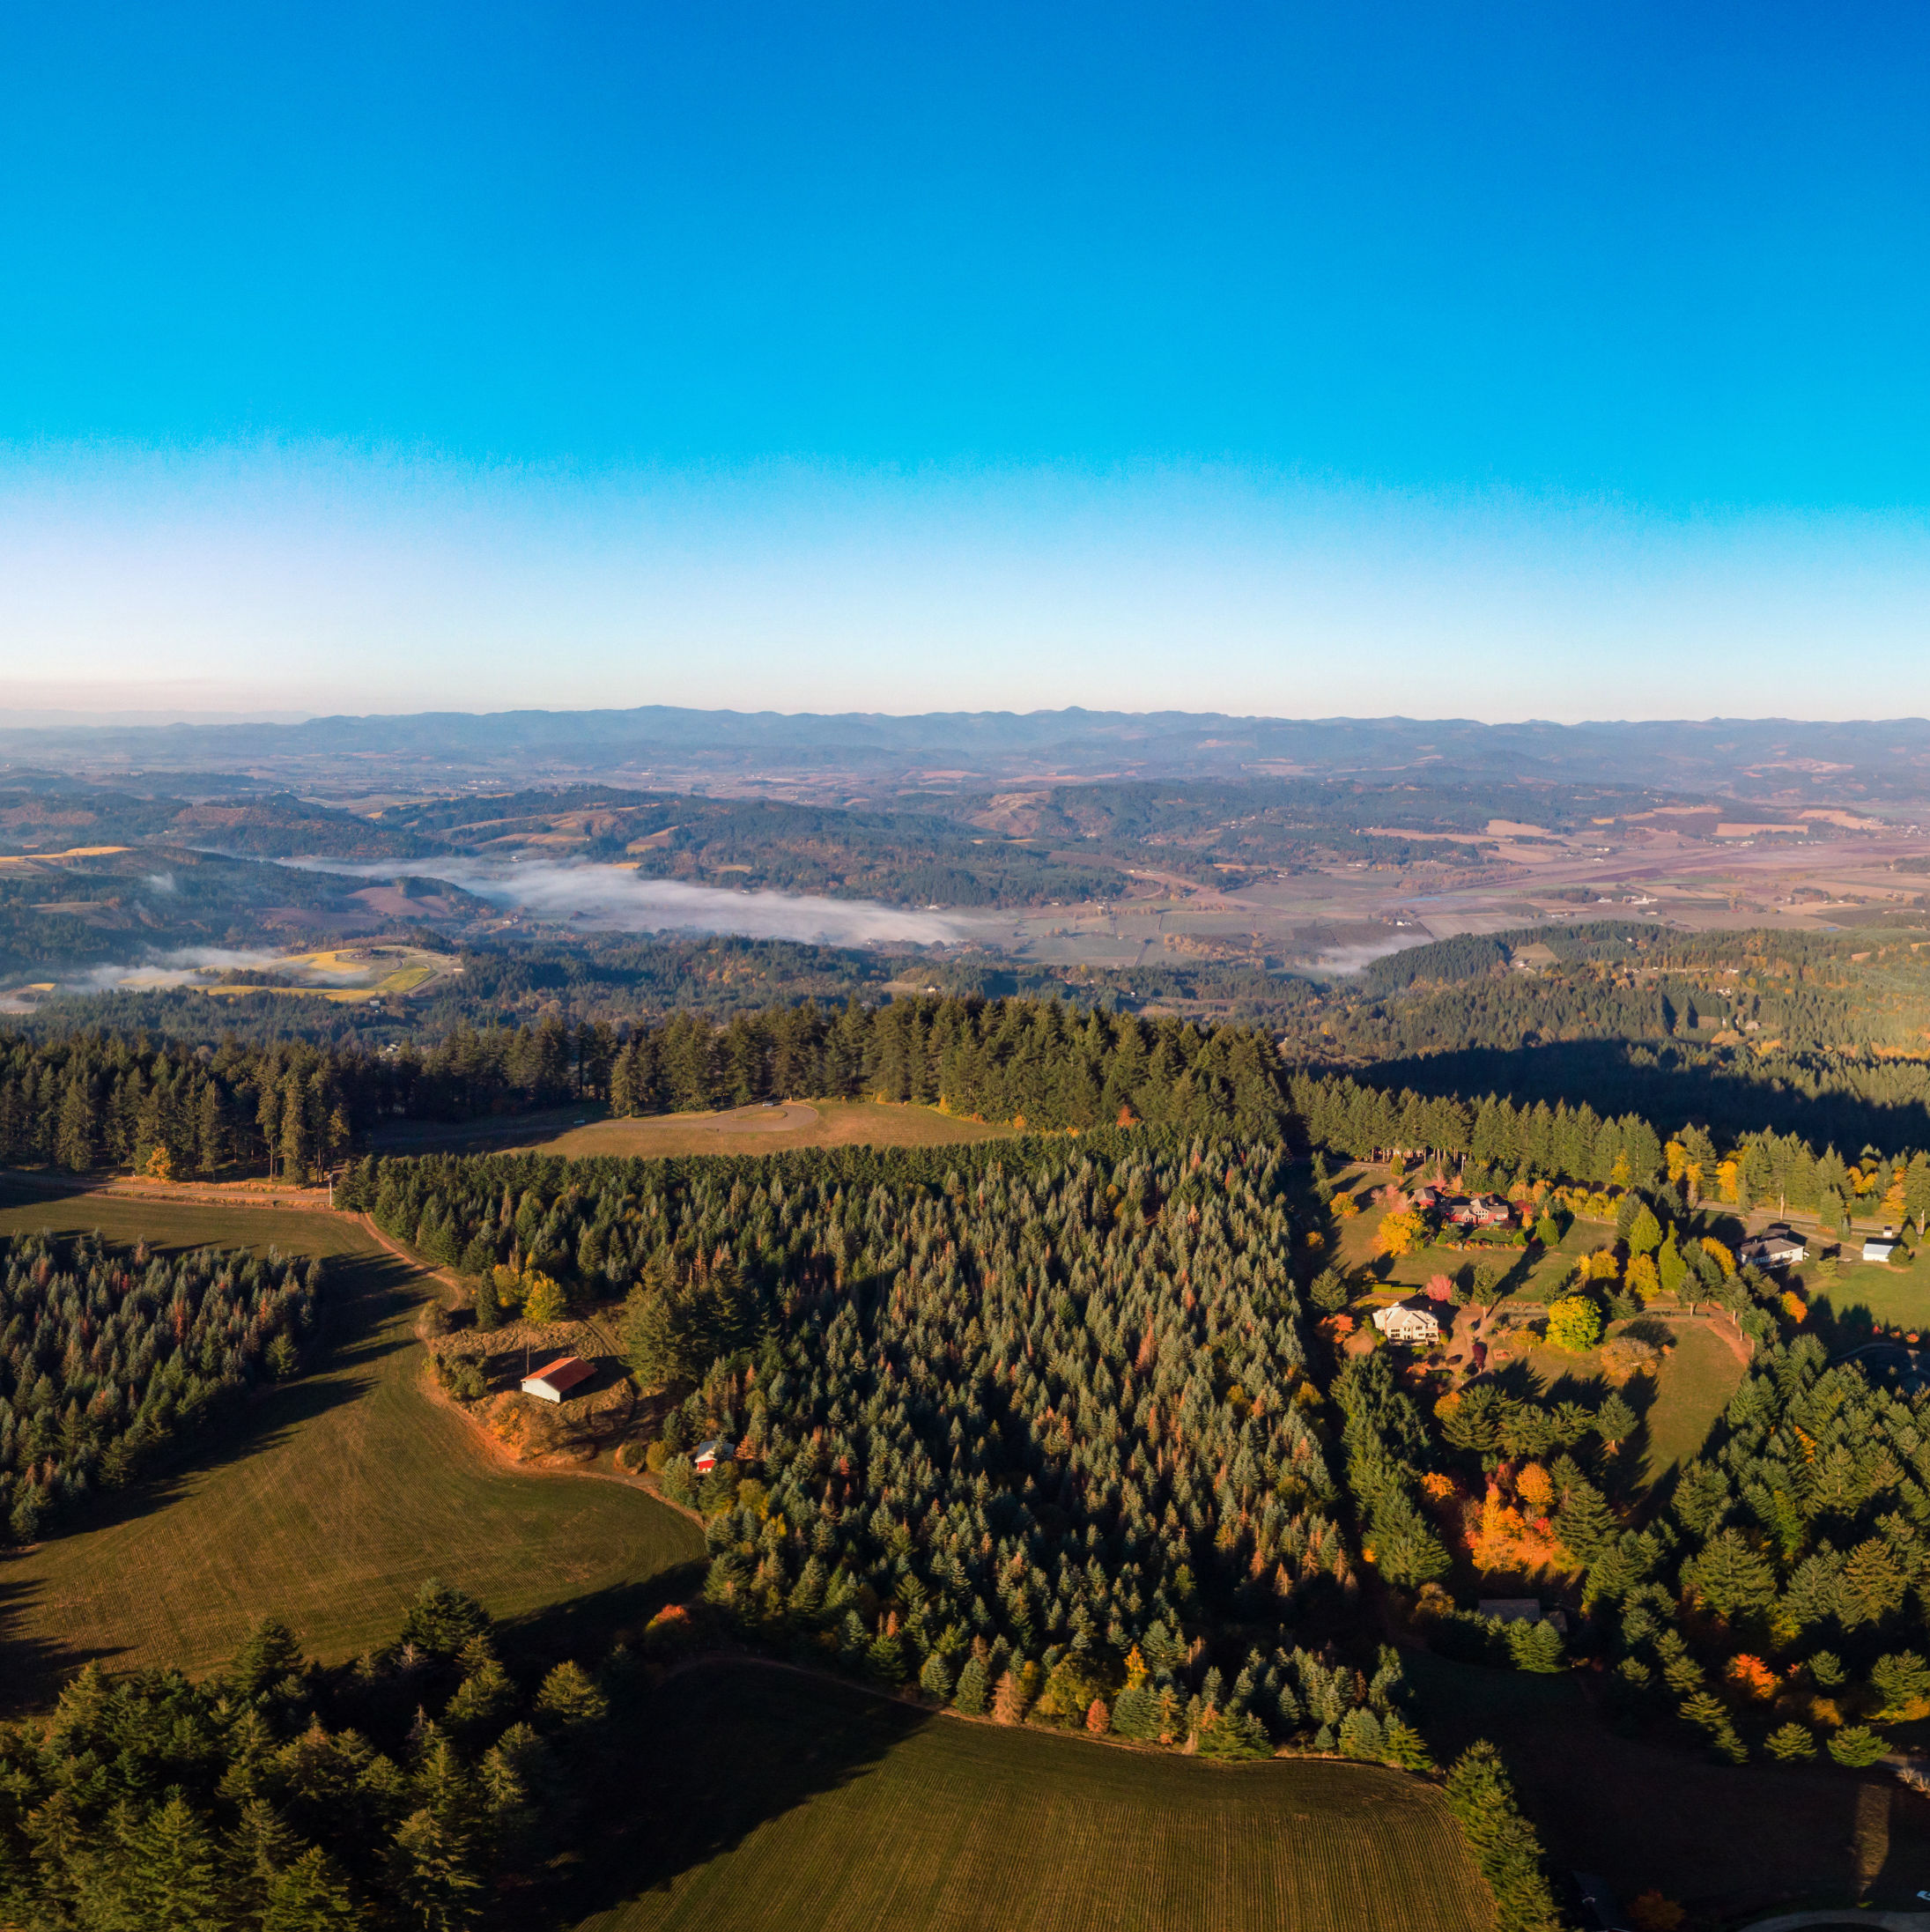
Living in the western suburbs puts you closer to this view of the Tualatin Valley, between Forest Grove and Newberg.
As goes Portland, so goes its suburbs—homes kept appreciating beyond city limits in recent years, with growth especially torrid in close-in enclaves like still-affordable Wood Village and tony Lake Oswego. The most homes changed hands last year in Hillsboro and Vancouver, with Gresham and Beaverton not far behind—but it was Tualatin and Gladstone where potential home-buyers had to act fastest. Homes there were on the market for an average of only 11 days before getting snatched up. Still, there are bargains to be had in the burbs, particularly if you're willing to live a little farther from the city's core: Consider pastoral Sauvie Island, Halloween mainstay St. Helens and nearly-but-not-quite Columbia Gorge–adjacent Fairview, where the median home sale price is still under $400,000.
| CITY | Median 2021 home sale price ($) | Average 2021 home sale price ($) | Homes sold in 2021 (#) | 1-year median price change 2020-21 (%) | 5-year median price change 2016-21 (%) | Days on market (average) | Condo sales among home sales (#) | Share of 2021 sales that were condos (%) | Short sales | Bank-owned sales | Average square feet of homes sold | Average cost per square foot ($) | Average year built of homes sold | Renters' median monthly housing ($) | Population | Population density people per sq mile) | Median age | Median household income ($) | Homeownership (%) | People below federal poverty level (%) | Unemployed (16 years and older) (%) | Households with children under 18 (%) | Married (except separated) (%) | Divorced (%) | Widowed (%) | Separated (%) | Never Married (%) | Population with bachelor degree as highest level of education (25 and older) (%) | Population with graduate degree (25 and older) (%) | English as only language (%) | People who speak other language(s) (%) | Population in same house a year before (%) | Population in different Oregon county in past year (%) | Population in different state in past year (%) | Population moved from abroad in past year (%) | Total newcomers (%) | Area (sq mile) | Miles of Bike Routes | Miles of Bike Routes per sq mile | Parks and Natural Areas | Parks and Natural Areas as % of City | Minutes by car to downtown (est.) | Minutes to downtown at rush hour (est.) | Number of transit lines | Walk Score |
|---|---|---|---|---|---|---|---|---|---|---|---|---|---|---|---|---|---|---|---|---|---|---|---|---|---|---|---|---|---|---|---|---|---|---|---|---|---|---|---|---|---|---|---|---|---|
| Beaverton | 495,000 | 502,208 | 1,442 | 16 | 51 | 13 | 338 | 23 | 0 | 3 | 1,822 | 286 | 1986 | 1,338 | 99,040 | 4,952 | 36 | 73,260 | 46.6 | 11.3 | 3.4 | 26.7 | 44.7 | 10.0 | 2.8 | 0.5 | 35.1 | 29.8 | 15.7 | 77.4 | 22.6 | 83.8 | 6.7 | 4.2 | 0.2 | 11.0 | 19.63 | 102.14 | 5.20 | 1.76 | 8.95 | 14 | 25 | 24 | 52 |
| Camas | 616,369 | 689,862 | 762 | 16 | 54 | 28 | 22 | 3 | 0 | 2 | 2,625 | 267 | 1998 | 1,236 | 23,200 | 1,547 | 40 | 111,584 | 77.7 | 3.5 | 2.2 | 45.1 | 63.9 | 9.2 | 2.6 | 1.2 | 23.1 | 29.2 | 23.5 | 88.8 | 11.2 | 87.5 | 0.2 | 4.8 | 0.2 | 5.2 | 15.47 | - | - | - | - | 26 | 35 | 1 | 18 |
| Canby | 471,000 | 464,753 | 295 | 7 | 45 | 16 | 9 | 3 | 0 | 2 | 1,938 | 249 | 1989 | 1,055 | 17,695 | 4,424 | 38 | 73,038 | 67.9 | 8.7 | 2.5 | 37.3 | 56.5 | 12.1 | 5.2 | 1.3 | 24.9 | 17.7 | 8.8 | 82.8 | 17.2 | 85.2 | 3.2 | 1.0 | 0.8 | 5.0 | 4.37 | 14.10 | 3.23 | 0.14 | 3.30 | 35 | 37 | 3 | 53 |
| Cornelius | 429,162 | 433,886 | 424 | 9 | 65 | 20 | 0 | 0 | 0 | 1 | 1,698 | 259 | 2010 | 1,102 | 12,638 | 6,319 | 32 | 67,207 | 78.5 | 6.7 | 2.3 | 46.1 | 46.7 | 9.1 | 4.7 | 1.8 | 37.6 | 11.4 | 4.3 | 47.9 | 52.1 | 85.2 | 0.5 | 2.7 | 0.0 | 3.2 | 2.24 | 5.94 | 2.65 | 0.08 | 3.66 | 35 | 37 | 2 | 57 |
| Estacada | 437,157 | 455,019 | 218 | 10 | 53 | 22 | 0 | 0 | 0 | 1 | 1,826 | 258 | 2008 | 1,217 | 3,426 | 1,713 | 34 | 71,088 | 73.1 | 7.0 | 2.3 | 33.0 | 58.5 | 8.7 | 7.6 | 3.0 | 22.2 | 12.3 | 6.5 | 96.8 | 3.2 | 83.7 | 2.0 | 0.5 | 0.0 | 2.5 | 2.25 | 2.35 | 1.04 | 0.05 | 2.08 | 45 | 53 | 2 | 68 |
| Fairview | 390,000 | 390,554 | 137 | 9 | 44 | 22 | 4 | 3 | 0 | 0 | 1,703 | 232 | 1995 | 1,232 | 9,363 | 2,341 | 39 | 68,259 | 58.4 | 6.9 | 3.7 | 24.6 | 53.2 | 14.1 | 4.9 | 4.0 | 23.9 | 13.6 | 7.0 | 78.7 | 21.3 | 86.6 | 2.0 | 4.9 | 0.0 | 6.9 | 3.53 | 18.64 | 5.28 | 0.56 | 15.93 | 20 | 28 | 2 | 54 |
| Forest Grove | 468,900 | 481,084 | 411 | 19 | 65 | 15 | 12 | 3 | 0 | 0 | 1,969 | 256 | 1977 | 1,081 | 24,457 | 4,076 | 34 | 64,172 | 59.4 | 10.6 | 3.3 | 35.0 | 47.3 | 10.4 | 5.6 | 1.7 | 35.0 | 18.4 | 10.0 | 80.8 | 19.2 | 81.8 | 2.7 | 3.4 | 0.5 | 6.6 | 5.98 | 18.19 | 3.04 | 0.49 | 8.21 | 40 | 43 | 2 | 28 |
| Gladstone | 450,000 | 465,753 | 183 | 8 | 48 | 11 | 3 | 2 | 0 | 0 | 1,789 | 283 | 1963 | 1,334 | 12,170 | 6,085 | 39 | 64,045 | 58.4 | 12.2 | 4.0 | 34.0 | 43.0 | 16.9 | 7.7 | 0.8 | 31.6 | 20.1 | 4.8 | 89.2 | 10.8 | 80.1 | 9.8 | 2.0 | 0.2 | 12.0 | 2.49 | 7.41 | 2.98 | 0.24 | 9.77 | 22 | 31 | 6 | 56 |
| Gresham | 435,000 | 435,215 | 1,440 | 14 | 58 | 18 | 119 | 8 | 3 | 3 | 1,828 | 251 | 1982 | 1,178 | 109,379 | 4,557 | 36 | 53,892 | 52.8 | 16.5 | 6.2 | 46.3 | 45.2 | 10.6 | 3.9 | 1.0 | 30.7 | 16.0 | 8.6 | 69.7 | 30.3 | 80.4 | 5.9 | 2.0 | 0.5 | 8.4 | 23.54 | 82.82 | 3.52 | 2.60 | 11.05 | 26 | 35 | 13 | 47 |
| Happy Valley | 598,929 | 650,607 | 846 | 12 | 42 | 31 | 8 | 1 | 1 | 1 | 2,698 | 246 | 2009 | 1,598 | 20,971 | 2,097 | 39 | 125,676 | 84.2 | 3.1 | 1.7 | 38.9 | 62.0 | 7.3 | 2.9 | 1.2 | 26.5 | 33.7 | 21.0 | 78.1 | 21.9 | 87.4 | 3.3 | 3.0 | 0.4 | 6.7 | 9.81 | 31.69 | 3.23 | 0.86 | 8.79 | 24 | 35 | 2 | 18 |
| Hillsboro | 480,000 | 489,184 | 1,863 | 16 | 55 | 15 | 208 | 11 | 0 | 1 | 1,848 | 274 | 1995 | 1,453 | 109,120 | 6,724 | 34 | 86,038 | 51.8 | 9.5 | 3.7 | 34.4 | 53.7 | 6.8 | 3.2 | 0.4 | 26.1 | 21.8 | 19.1 | 63.5 | 36.5 | 80.6 | 8.4 | 6.1 | 1.2 | 15.8 | 24.75 | 86.85 | 3.51 | 1.79 | 7.23 | 30 | 34 | 12 | 44 |
| Lake Oswego | 859,500 | 1,051,465 | 1,000 | 21 | 51 | 24 | 197 | 20 | 0 | 5 | 2,732 | 373 | 1982 | 1,614 | 39,127 | 3,557 | 47 | 108,927 | 73.6 | 3.9 | 2.5 | 30.0 | 61.2 | 10.6 | 5.3 | 0.9 | 22.0 | 41.3 | 30.1 | 86.2 | 13.8 | 85.8 | 4.9 | 2.9 | 1.3 | 9.1 | 11.41 | 30.02 | 2.63 | 1.02 | 8.92 | 16 | 17 | 4 | 37 |
| Maywood Park | 580,000 | 558,748 | 18 | 20 | 64 | 14 | 0 | 0 | 0 | 0 | 2,577 | 227 | 1947 | 1,550 | 995 | 5,853 | 41 | 99,750 | 86.9 | 9.3 | 2.8 | 59.9 | 59.9 | 10.7 | 3.6 | 0.0 | 25.7 | 26.6 | 17.4 | 94.9 | 5.1 | 93.9 | 1.6 | 1.8 | 0.0 | 3.4 | 0.17 | 1.35 | 8.07 | 0.00 | 0.73 | 14 | 21 | 0 | 60 |
| McMinnville | 420,000 | 426,993 | 509 | 12 | 62 | 15 | 4 | 1 | 0 | 1 | 1,776 | 250 | 1985 | 987 | 34,010 | 3,092 | 36 | 54,254 | 61.9 | 14.3 | 2.2 | 30.1 | 45.7 | 14.9 | 7.6 | 1.7 | 30.2 | 15.8 | 10.2 | 81.6 | 18.4 | 82.6 | 3.8 | 2.7 | 0.5 | 7.0 | 10.54 | - | - | - | - | 55 | 67 | 8 | 43 |
| Milwaukie | 473,700 | 496,474 | 327 | 12 | 51 | 13 | 14 | 4 | 0 | 1 | 1,756 | 306 | 1964 | 1,173 | 21,009 | 4,202 | 41 | 61,902 | 58.8 | 11.2 | 2.8 | 23.5 | 43.6 | 16.0 | 5.9 | 1.2 | 33.3 | 23.1 | 13.1 | 92.2 | 7.8 | 83.6 | 7.5 | 4.3 | 0.2 | 12.0 | 5.07 | 11.78 | 2.32 | 0.17 | 3.41 | 14 | 20 | 11 | 53 |
| Newberg | 425,000 | 439,911 | 467 | 0 | 51 | 21 | 15 | 3 | 0 | 1 | 1,711 | 266 | 1991 | 1,125 | 23,396 | 3,899 | 34 | 64,202 | 65.0 | 15.8 | 2.6 | 34.4 | 47.1 | 11.2 | 3.9 | 1.1 | 36.6 | 21.7 | 9.8 | 87.7 | 12.3 | 81.9 | 7.6 | 2.9 | 0.3 | 10.8 | 5.80 | - | - | - | - | 37 | 47 | 3 | 44 |
| Oregon City | 520,000 | 513,480 | 649 | 10 | 49 | 14 | 7 | 1 | 0 | 0 | 1,982 | 274 | 1984 | 1,275 | 36,492 | 3,649 | 38 | 76,149 | 66.2 | 7.6 | 3.6 | 35.6 | 51.7 | 13.8 | 4.6 | 1.7 | 28.2 | 19.3 | 7.0 | 93.6 | 6.4 | 81.5 | 4.8 | 1.6 | 0.1 | 6.5 | 9.87 | 34.07 | 3.45 | 0.64 | 6.51 | 26 | 34 | 10 | 38 |
| Portland | 510,000 | 574,526 | 12,103 | 10 | 34 | 25 | 2191 | 18 | 8 | 27 | 1913 | 321 | 1957 | 1,248 | 653,467 | 4,506 | 37 | 76,231 | 53.8 | 13.7 | 3.8 | 24.2 | 39.7 | 10.8 | 3.1 | 1.1 | 36.2 | 31.4 | 21.4 | 76.9 | 23.1 | 81.7 | 7.1 | 6.1 | 0.6 | 13.8 | 145.07 | 460.52 | 3.17 | 20.19 | 13.92 | - | - | 66 | 67 |
| Sauvie Island | 369,000 | 440,935 | 26 | -54 | -50 | 66 | 0 | 0 | 0 | 0 | 1,648 | 268 | 1991 | 1,422 | 2,567 | 81 | 53 | 95,000 | 84.2 | 8.1 | 3.1 | 22.3 | 53.7 | 12.6 | 3.5 | 1.2 | 28.9 | 31.4 | 13.0 | 95.8 | 4.2 | 87.5 | 9.0 | 3.5 | 0.0 | 12.5 | 31.54 | 0.29 | 0.01 | 2.54 | 8.05 | 35 | 42 | 1 | 6 |
| Scappoose | 420,000 | 415,591 | 131 | 8 | 62 | 13 | 1 | 1 | 0 | 0 | 1,767 | 245 | 1993 | 1,250 | 7,270 | 2,423 | 36 | 80,171 | 68.8 | 8.8 | 1.6 | 34.2 | 51.7 | 12.7 | 6.6 | 2.4 | 26.6 | 17.7 | 8.9 | 94.5 | 5.5 | 81.8 | 7.6 | 1.4 | 0.0 | 9.0 | 3.28 | - | - | - | - | 30 | 36 | 2 | 63 |
| Sherwood | 540,000 | 545,753 | 360 | 5 | 56 | 14 | 44 | 12 | 0 | 1 | 2,007 | 279 | 1999 | 1,485 | 19,625 | 4,906 | 37 | 103,512 | 77.3 | 2.9 | 1.3 | 45.0 | 61.0 | 9.0 | 3.8 | 0.8 | 25.4 | 32.4 | 17.6 | 89.7 | 10.3 | 84.2 | 4.3 | 3.0 | 0.2 | 7.5 | 4.34 | 20.95 | 4.83 | 0.39 | 8.88 | 30 | 36 | 4 | 38 |
| St.Helens | 379,900 | 377,942 | 355 | 18 | 65 | 13 | 4 | 1 | 1 | 0 | 1,692 | 235 | 1991 | 901 | 13,559 | 2,260 | 38 | 51,199 | 61.2 | 16.8 | 3.8 | 36.6 | 41.6 | 17.3 | 6.8 | 1.7 | 32.6 | 11.0 | 4.8 | 96.1 | 3.9 | 82.2 | 4.8 | 3.7 | 0.0 | 8.5 | 5.82 | - | - | - | - | 40 | 47 | 10 | 71 |
| Tigard | 540,000 | 544,617 | 984 | 12 | 42 | 14 | 121 | 12 | 1 | 2 | 2,024 | 286 | 1990 | 1,243 | 53,312 | 4,101 | 37 | 79,809 | 61.5 | 8.9 | 2.6 | 31.1 | 51.7 | 11.1 | 4.8 | 1.4 | 31.0 | 28.5 | 15.7 | 80.3 | 19.7 | 85.4 | 3.6 | 2.7 | 0.5 | 6.8 | 12.71 | 48.88 | 3.85 | 0.84 | 6.61 | 18 | 22 | 4 | 43 |
| Troutdale | 450,000 | 446,351 | 253 | 18 | 58 | 15 | 5 | 2 | 0 | 0 | 1,785 | 264 | 1992 | 1,195 | 16,466 | 2,744 | 35 | 76,598 | 66.3 | 9.8 | 3.2 | 37.9 | 50.6 | 11.1 | 2.9 | 1.1 | 34.3 | 17.4 | 5.5 | 80.8 | 19.2 | 86.5 | 0.9 | 1.6 | 0.7 | 3.2 | 6.02 | 22.51 | 3.74 | 0.64 | 10.66 | 23 | 32 | 5 | 58 |
| Tualatin | 568,000 | 580,481 | 385 | 16 | 48 | 11 | 48 | 12 | 1 | 0 | 2,184 | 277 | 1991 | 1,335 | 27,527 | 3,441 | 38 | 85,772 | 56.2 | 10.2 | 2.6 | 32.4 | 53.6 | 11.5 | 2.9 | 1.4 | 30.7 | 29.1 | 16.2 | 82.7 | 17.3 | 86.0 | 5.6 | 3.3 | 0.2 | 9.1 | 8.15 | 43.22 | 5.30 | 0.54 | 6.56 | 21 | 23 | 15 | 29 |
| Vancouver | 405,000 | 444,240 | 2,860 | 7 | 56 | 16 | 363 | 13 | 0 | 9 | 1,679 | 274 | 1979 | 1,219 | 184,452 | 3,689 | 37 | 66,679 | 48.4 | 12.7 | 4.7 | 29.3 | 42.5 | 11.7 | 5.5 | 2.3 | 27.8 | 21.3 | 10.3 | 74.8 | 25.2 | 77.9 | 8.4 | 6.8 | 1.2 | 16.4 | 50.02 | - | - | - | - | 15 | 26 | 30 | 41 |
| Washougal | 500,000 | 517,714 | 352 | 12 | 53 | 20 | 33 | 9 | 0 | 1 | 2,220 | 245 | 1992 | 1,171 | 15,769 | 2,628 | 40 | 91,100 | 76.2 | 7.4 | 2.4 | 36.4 | 58.9 | 11.7 | 4.3 | 1.3 | 23.9 | 22.1 | 10.0 | 94.0 | 6.0 | 84.6 | 0.7 | 3.8 | 0.3 | 4.8 | 6.24 | - | - | - | - | 28 | 36 | 1 | 33 |
| West Linn | 654,950 | 682,971 | 630 | 9 | 44 | 18 | 84 | 13 | 0 | 1 | 2,560 | 280 | 1974 | 1,588 | 26,656 | 3,332 | 42 | 111,042 | 81.6 | 5.1 | 3.2 | 37.4 | 62.2 | 10.7 | 3.4 | 0.5 | 23.2 | 37.5 | 24.0 | 86.4 | 13.6 | 88.9 | 4.2 | 2.3 | 0.6 | 7.1 | 8.09 | 24.61 | 3.04 | 0.94 | 11.62 | 26 | 32 | 2 | 34 |
| Wilsonville | 552,450 | 563,395 | 504 | 15 | 41 | 16 | 51 | 10 | 3 | 0 | 2,096 | 274 | 1999 | 1,360 | 24,073 | 3,009 | 36 | 72,312 | 45.4 | 9.7 | 2.5 | 28.7 | 49.9 | 14.9 | 4.9 | 1.5 | 28.8 | 29.4 | 16.4 | 86.7 | 13.3 | 78.1 | 8.7 | 4.7 | 0.8 | 14.2 | 7.59 | 31.53 | 4.15 | 0.70 | 9.20 | 25 | 28 | 10 | 30 |
| Wood Village | 370,000 | 386,873 | 37 | 23 | 68 | 13 | 8 | 22 | 0 | 0 | 1,568 | 269 | 1976 | - | 4,057 | 4,057 | 31 | 56,905 | 45.6 | 16.9 | 2.1 | 58.5 | 36.3 | 12.5 | 3.8 | 2.2 | 45.2 | 8.2 | 3.6 | 43.6 | 56.4 | 86.6 | 4.1 | 1.8 | 0.0 | 5.9 | 0.95 | 5.69 | 5.97 | 0.03 | 3.47 | 20 | 28 | 2 | 52 |
Methodology
Real Estate 2021 data from the Regional Multiple Listing Service with analysis by the Center for Spatial Analysis and Research at Portland State University’s Department of Geography. Figures were rounded for legibility. In places with very few home sales, such as Sauvie Island, the year-to-year change can appear exaggerated.
People Data for demographics columns and rent costs from the US Census Bureau’s American Community Survey 5-Year Estimates, released December 2020. The ACS data are estimates only and accuracy varies by attribute.
Rent Costs Calculated from all renter-occupied units, estimated median rent is not adjusted for unit size or number of occupants. Figure includes estimated monthly utility costs.
Median Income The Census defines household as including “all the persons who occupy a housing unit as their usual place of residence.” Thus living situations in this estimate range from individuals to large households.
Parks Data from Metro and/or individual cities.
Transit City and suburb transit information was sourced from TriMet as well as other services, including CC Rider, C-TRAN, Canby Area Transit, Sandy Area Metro, and South Metro Area Regional Transit.
Minutes by Car to Downtown Google Maps estimate, based on February 2022 non-rush-hour conditions, from a suburb central point to Portland’s Pioneer Courthouse Square. Rush-hour travel time was estimated for a 9 a.m. weekday arrival.
Walk Score 2022 data from WalkScore.com, now a part of real estate agency Redfin. This score reflects, on a scale of 1 to 100, a neighborhood or city’s pedestrian-friendliness based on distances to amenities such as grocery stores and other routine destinations.
Unavailable Data is noted with a dash (—).
Real estate and other analysis by David Banis, Marty Marquis, and Elizabeth Martin of PSU’s Center for Spatial Analysis and Research. Additional research by Shannon Daehnke, Karly Quadros, Margaret Seiler, and Julia Silverman.