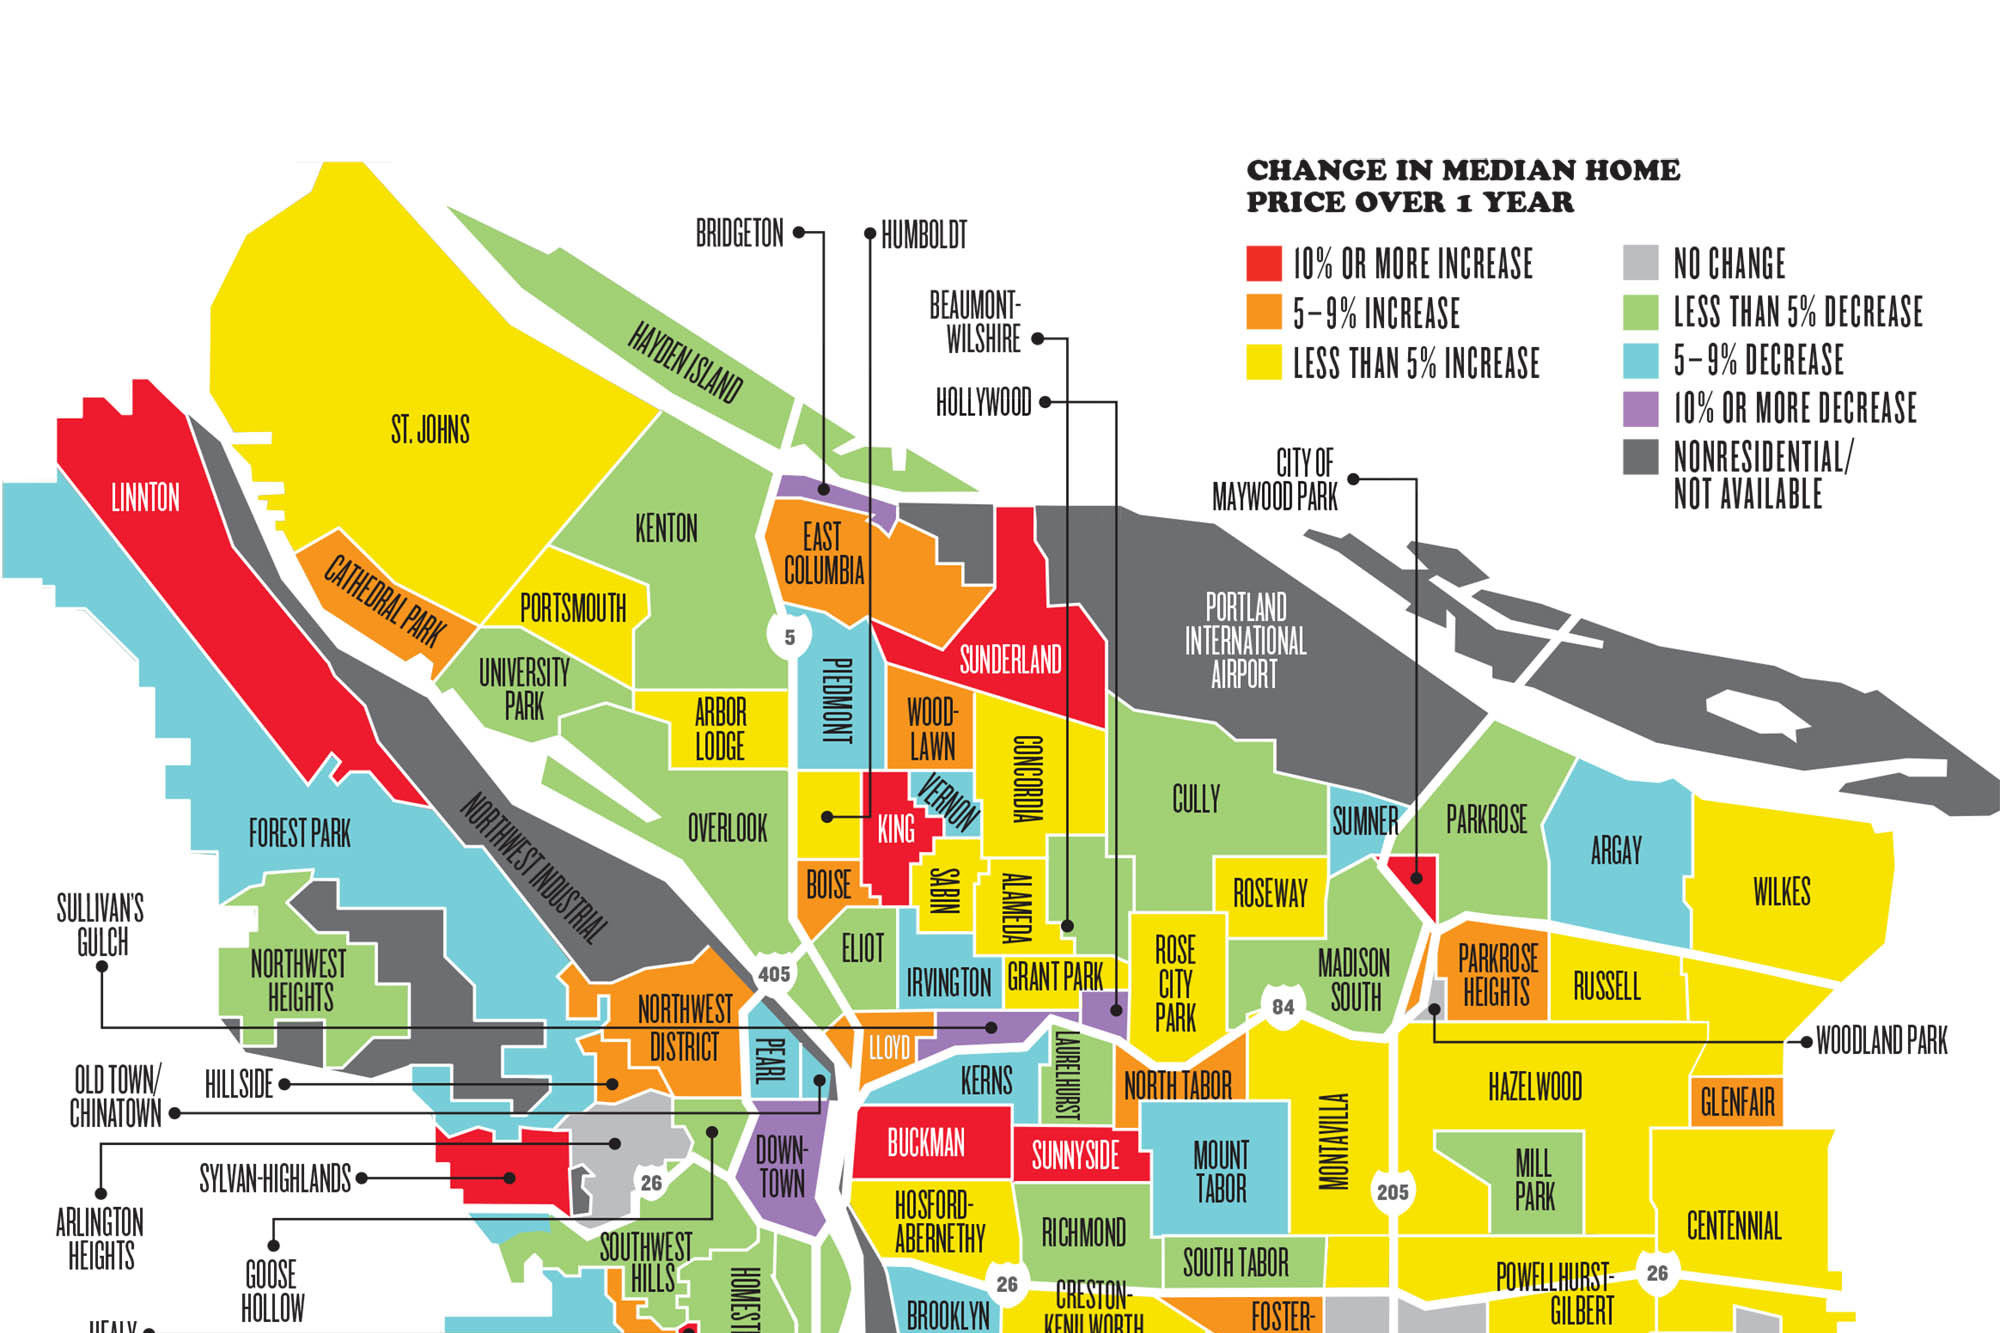
Portland Neighborhoods by the Numbers
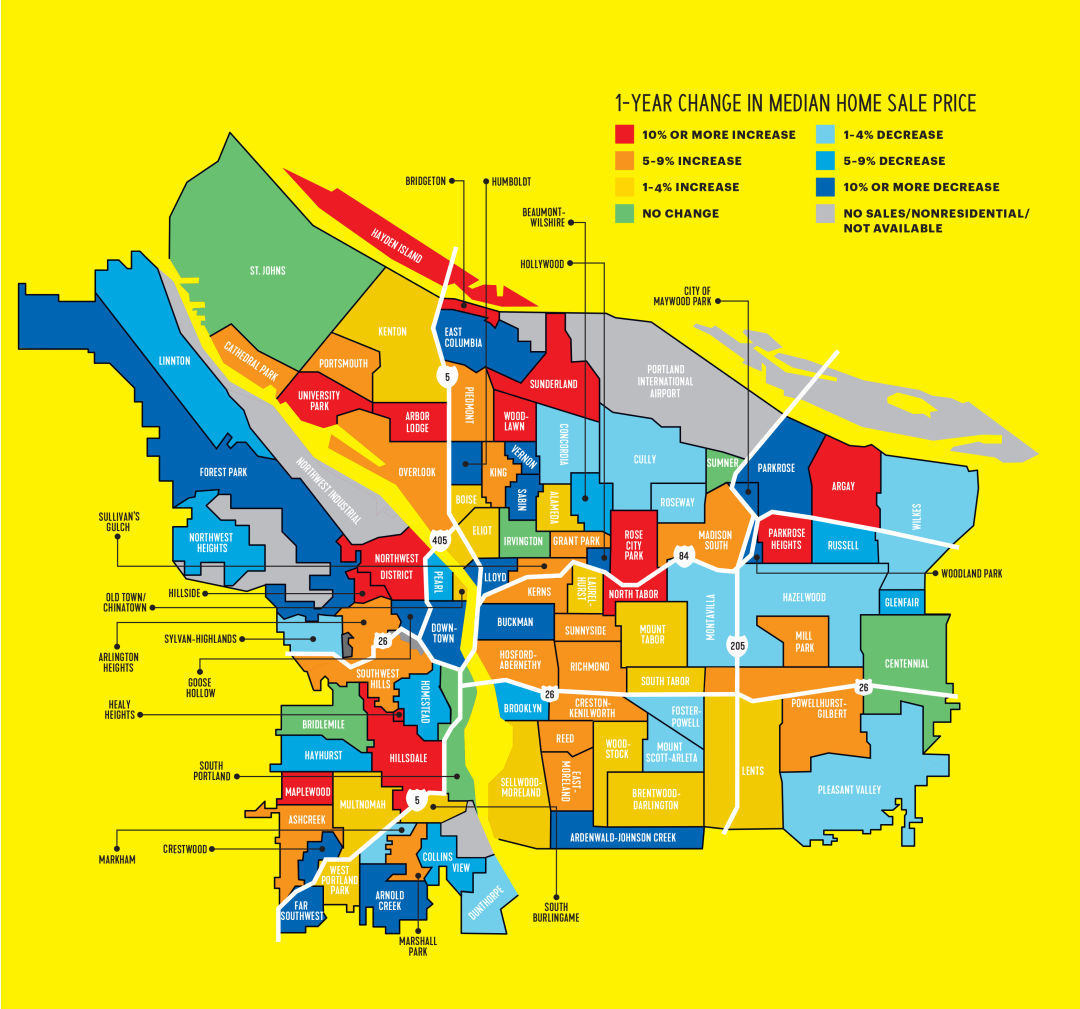
Image: Michael Novak
In a hurry? You might want to slow down. Home sales across Portland and most of its suburbs chilled out over the past year, with places often lingering on the market for close to two months. Prices ticked up just 3 percent after remaining flat the year before—but they’re still about 20 percent higher than in 2020.
A few other observations:
- Find homes as old as Dick Van Dyke in Laurelhurst and Grant Park.
- Dreaming of a place under $300K? Watch for a condo in Goose Hollow.
- Lots of square footage in Dunthorpe (NBA player–friendly high ceilings, too).
- Got strollers? East-side hoods like King, Irvington, and Sunnyside are rich in sidewalks.
- Want to take it slow? Places sit on the market a while in the Pearl and Bridgeton.
- Get the most house for the money in East Columbia and Russell.
Looking for other specifics about Portland neighborhoods? Check out the details below.
| Neighborhood | Median 2025 home sale price ($) | Average 2025 home sale price ($) | Homes sold in 2025 (#) | 1-year median price change 2024-25 (%) | 5-year median price change 2020-25 (%) | Average days on market | Share of 2025 sales that were condos (%) | Short sales | Bank-owned dales | Average square feet of homes sold | Average cost per square foot ($) | Average year built of homes sold | Renters' median monthly housing ($) | Residential units classified as "affordable" (#) | Population | Population density (people per square mile) | Median age | Median household income | Homeownership (%) | People below federal poverty level (%) | Unemployed rate (%) | Households with children under 18 (%) | Married (except separated) (%) | Widowed (%) | Divorced (%) | Separated (%) | Never married (%) | Population over 25, highest degree is a bachelor's (%) | Speak only English (%) | Speak a language other than English (%) | Population in same house a year before (%) | Moved within the last year, from the same county (%) | Moved within the last year, from a different Oregon county (%) | Moved within the last year, from a different state (%) | Moved from abroad within the last year (%) | Moved from outside county in past year, total (%) | Area in square miles | Share of road miles with full sidewalks (%) | Miles of bike routes | Parks as % of neighborhood | Commuting by walking (%) | Commuting by public transit (%) | Commuting by bike (%) | Walk Score |
|---|---|---|---|---|---|---|---|---|---|---|---|---|---|---|---|---|---|---|---|---|---|---|---|---|---|---|---|---|---|---|---|---|---|---|---|---|---|---|---|---|---|---|---|---|
| ALAMEDA | 939,675 | 1,003,472 | 69 | 4 | 23 | 29 | 0 | 0 | 0 | 2,823 | 355 | 1929 | 2,712 | - | 5,591 | 9,368 | 44 | 175,711 | 79 | 4 | 8 | 31 | 65 | 3 | 6 | 1 | 26 | 37 | 93 | 7 | 90 | 7 | 1 | 2 | 0 | 3 | 0.6 | 98 | 2 | 0 | 3 | 4 | 2 | 64 |
| ARBOR LODGE | 563,500 | 563,000 | 110 | 19 | 13 | 41 | 12 | 1 | 1 | 1,945 | 290 | 1946 | 1,916 | 157 | 7,165 | 8,259 | 38 | 119,349 | 68 | 8 | 5 | 21 | 44 | 3 | 10 | 0 | 43 | 41 | 90 | 10 | 83 | 12 | 2 | 3 | 1 | 5 | 0.9 | 79 | 8 | 2 | 4 | 3 | 2 | 79 |
| ARDENWALD-JOHNSON CREEK | 526,750 | 538,400 | 6 | -19 | 8 | 127 | 0 | 0 | 0 | 1,584 | 340 | 1987 | 2,207 | - | 2,053 | 6,108 | 42 | 169,388 | 83 | 6 | 4 | 35 | 56 | 4 | 11 | 1 | 29 | 33 | 90 | 10 | 85 | 8 | 4 | 2 | 0 | 6 | 0.3 | 19 | 3 | 17 | 2 | 3 | 2 | 57 |
| ARGAY | 550,000 | 499,264 | 41 | 11 | 29 | 47 | 7 | 2 | 0 | 2,005 | 249 | 1969 | 1,555 | - | 5,735 | 2,794 | 41 | 56,770 | 57 | 23 | 9 | 30 | 29 | 5 | 16 | 3 | 46 | 13 | 74 | 26 | 76 | 11 | 9 | 4 | 0 | 13 | 2.1 | 53 | 6 | 5 | 7 | 0 | 6 | 44 |
| ARLINGTON HEIGHTS | 1,250,000 | 1,285,082 | 17 | 9 | 42 | 38 | 0 | 0 | 0 | 3,327 | 386 | 1958 | 1,410 | - | 2,124 | 2,601 | 50 | 173,783 | 79 | 6 | 5 | 20 | 65 | 1 | 5 | 0 | 28 | 36 | 88 | 12 | 82 | 11 | 3 | 2 | 1 | 6 | 0.8 | 10 | 1 | 63 | 2 | 1 | 10 | 35 |
| ARNOLD CREEK | 789,450 | 840,290 | 52 | -12 | 20 | 49 | 0 | 0 | 0 | 2,640 | 318 | 1986 | 1,877 | - | 3,017 | 2,753 | 44 | 162,691 | 90 | 3 | 2 | 36 | 67 | 5 | 9 | 0 | 20 | 39 | 85 | 15 | 92 | 5 | 1 | 2 | 0 | 3 | 1.1 | 11 | - | 3 | 0 | 1 | 0 | 20 |
| ASHCREEK | 635,000 | 659,912 | 97 | 6 | 28 | 40 | 1 | 1 | 0 | 2,127 | 310 | 1975 | 1,601 | 21 | 5,175 | 4,337 | 43 | 139,188 | 85 | 4 | 4 | 28 | 58 | 4 | 12 | 1 | 25 | 40 | 90 | 10 | 94 | 3 | 2 | 1 | 0 | 3 | 1.2 | 10 | 1 | 2 | 4 | 1 | 0 | 35 |
| BEAUMONT-WILSHIRE | 682,500 | 732,099 | 108 | -6 | 0 | 36 | 10 | 0 | 0 | 2,103 | 348 | 1962 | 1,893 | - | 5,949 | 7,812 | 46 | 126,216 | 89 | 5 | 4 | 32 | 60 | 3 | 10 | 1 | 27 | 38 | 92 | 8 | 92 | 5 | 0 | 2 | 0 | 3 | 0.8 | 91 | 4 | 3 | 2 | 5 | 3 | 78 |
| BOISE | 630,000 | 646,910 | 39 | 3 | 19 | 80 | 31 | 0 | 0 | 2,088 | 310 | 1967 | 1,806 | 450 | 5,439 | 12,712 | 34 | 95,507 | 30 | 15 | 7 | 15 | 26 | 2 | 13 | 1 | 59 | 42 | 86 | 14 | 75 | 13 | 4 | 6 | 2 | 12 | 0.4 | 92 | 3 | 2 | 11 | 6 | 4 | 93 |
| BRENTWOOD-DARLINGTON | 419,450 | 424,906 | 216 | 1 | 15 | 48 | 9 | 1 | 1 | 1,382 | 308 | 1970 | 1,706 | 172 | 12,767 | 7,343 | 37 | 79,903 | 70 | 14 | 4 | 34 | 42 | 4 | 15 | 1 | 38 | 24 | 80 | 20 | 87 | 5 | 5 | 3 | 0 | 8 | 1.7 | 24 | 8 | 4 | 6 | 4 | 3 | 65 |
| BRIDGETON | 400,000 | 387,292 | 16 | 14 | 29 | 133 | 13 | 0 | 0 | 1,601 | 242 | 1990 | 1,737 | - | 74 | 273 | 41 | 85,938 | 61 | 15 | 2 | 24 | 40 | 3 | 17 | 1 | 40 | 32 | 66 | 35 | 82 | 10 | 1 | 6 | 0 | 8 | 0.3 | 19 | 4 | 1 | 6 | 1 | 0 | 22 |
| BRIDLEMILE* | 800,500 | 895,487 | 76 | 0 | 15 | 51 | 1 | 0 | 0 | 2,779 | 322 | 1973 | 1,677 | 97 | 4,779 | 4,090 | 40 | 129,473 | 70 | 8 | 4 | 35 | 57 | 5 | 11 | 0 | 27 | 38 | 88 | 12 | 90 | 4 | 2 | 3 | 1 | 5 | 1.2 | 6 | 2 | 4 | 4 | 1 | 0 | 41 |
| BROOKLYN | 472,500 | 499,063 | 40 | -7 | -6 | 38 | 33 | 0 | 0 | 1,644 | 304 | 1968 | 1,723 | 96 | 7,223 | 4,208 | 40 | 93,886 | 50 | 9 | 8 | 21 | 41 | 2 | 12 | 1 | 44 | 35 | 91 | 9 | 82 | 8 | 2 | 7 | 0 | 9 | 1.7 | 68 | 5 | 6 | 7 | 9 | 7 | 82 |
| BUCKMAN | 577,000 | 597,821 | 49 | -10 | 1 | 38 | 35 | 0 | 0 | 2,103 | 284 | 1929 | 1,518 | 764 | 9,726 | 8,429 | 35 | 66,397 | 10 | 17 | 6 | 3 | 20 | 1 | 15 | 2 | 62 | 39 | 90 | 10 | 67 | 18 | 5 | 9 | 1 | 15 | 1.2 | 95 | 11 | 2 | 10 | 6 | 9 | 92 |
| CATHEDRAL PARK | 397,500 | 420,858 | 66 | 8 | 3 | 58 | 29 | 0 | 1 | 1,480 | 284 | 1966 | 1,592 | 130 | 4,737 | 4,619 | 39 | 75,349 | 54 | 12 | 4 | 17 | 28 | 5 | 14 | 2 | 51 | 36 | 89 | 11 | 81 | 13 | 2 | 3 | 0 | 5 | 1.0 | 56 | 2 | 10 | 6 | 2 | 2 | 80 |
| CENTENNIAL | 400,000 | 373,318 | 234 | 0 | 18 | 55 | 9 | 3 | 5 | 1,417 | 263 | 1969 | 1,404 | 513 | 23,444 | 7,194 | 39 | 64,863 | 61 | 18 | 7 | 34 | 43 | 5 | 12 | 2 | 38 | 11 | 68 | 32 | 86 | 9 | 2 | 3 | 0 | 4 | 3.3 | 30 | 13 | 4 | 7 | 1 | 1 | 58 |
| COLLINS VIEW | 715,000 | 807,493 | 26 | -7 | 30 | 33 | 0 | 0 | 0 | 2,261 | 357 | 1980 | 1,974 | - | 1,519 | 1,748 | 33 | 158,907 | 91 | 3 | 4 | 34 | 48 | 2 | 5 | 0 | 44 | 43 | 88 | 12 | 85 | 4 | 3 | 7 | 0 | 11 | 0.9 | 1 | 2 | 1 | 3 | 1 | 10 | 25 |
| CONCORDIA | 600,000 | 607,831 | 140 | -1 | 12 | 28 | 13 | 0 | 2 | 1,937 | 314 | 1960 | 2,004 | 100 | 10,166 | 7,664 | 40 | 120,784 | 76 | 7 | 9 | 27 | 48 | 3 | 9 | 1 | 39 | 38 | 92 | 8 | 85 | 9 | 2 | 3 | 1 | 6 | 1.3 | 77 | 7 | 3 | 5 | 4 | 3 | 76 |
| CRESTON-KENILWORTH | 532,500 | 538,270 | 72 | 5 | 8 | 53 | 10 | 1 | 0 | 1,890 | 285 | 1953 | 1,563 | 160 | 8,974 | 11,183 | 35 | 86,804 | 44 | 15 | 7 | 21 | 37 | 4 | 9 | 0 | 51 | 38 | 87 | 13 | 73 | 14 | 3 | 10 | 0 | 13 | 0.8 | 91 | 4 | 5 | 12 | 7 | 5 | 81 |
| CRESTWOOD | 508,500 | 540,685 | 20 | -12 | 7 | 27 | 0 | 0 | 0 | 1,526 | 354 | 1972 | 1,598 | - | 1,434 | 4,251 | 43 | 144,910 | 88 | 4 | 4 | 30 | 60 | 4 | 11 | 1 | 24 | 40 | 90 | 10 | 95 | 3 | 2 | 0 | 0 | 3 | 0.3 | 4 | - | 26 | 4 | 1 | 0 | 47 |
| CULLY | 435,000 | 449,624 | 131 | -3 | 2 | 70 | 28 | 0 | 1 | 1,434 | 314 | 1973 | 1,418 | 594 | 13,239 | 4,219 | 37 | 66,766 | 56 | 20 | 10 | 30 | 28 | 3 | 16 | 2 | 50 | 23 | 77 | 23 | 81 | 9 | 7 | 3 | 0 | 10 | 3.1 | 22 | 9 | 3 | 5 | 4 | 4 | 58 |
| DOWNTOWN | 300,000 | 424,811 | 111 | -14 | -17 | 119 | 100 | 0 | 1 | 1,133 | 375 | 1984 | 1,326 | 3,654 | 14,194 | 15,057 | 38 | 58,412 | 14 | 29 | 8 | 3 | 22 | 2 | 17 | 3 | 55 | 26 | 86 | 14 | 58 | 18 | 11 | 11 | 2 | 24 | 0.9 | 88 | 12 | 7 | 18 | 2 | 24 | 96 |
| DUNTHORPE | 1,855,000 | 2,049,924 | 34 | -3 | 9 | 77 | 0 | 0 | 0 | 4,554 | 450 | 1960 | 1,974 | - | 2,066 | 1,751 | 33 | 158,270 | 91 | 3 | 4 | 34 | 48 | 2 | 5 | 0 | 44 | 43 | 89 | 11 | 85 | 4 | 3 | 7 | 0 | 11 | 1.2 | 3 | - | - | 3 | 1 | 10 | 11 |
| EAST COLUMBIA | 406,525 | 361,593 | 22 | -19 | 6 | 77 | 0 | 0 | 2 | 1,644 | 220 | 1974 | 1,735 | - | 611 | 272 | 40 | 85,705 | 61 | 15 | 2 | 24 | 40 | 3 | 17 | 1 | 40 | 32 | 66 | 34 | 82 | 10 | 1 | 6 | 0 | 8 | 2.2 | 12 | 8 | 10 | 6 | 1 | 0 | 14 |
| EASTMORELAND | 951,000 | 1,008,413 | 60 | 6 | 21 | 35 | 0 | 0 | 0 | 3,037 | 332 | 1939 | 2,187 | - | 6,692 | 6,025 | 41 | 163,843 | 77 | 6 | 5 | 31 | 51 | 3 | 11 | 1 | 33 | 36 | 91 | 9 | 82 | 11 | 3 | 3 | 0 | 7 | 1.1 | 67 | 3 | 2 | 4 | 3 | 4 | 53 |
| ELIOT | 525,000 | 540,924 | 51 | 2 | -2 | 81 | 20 | 0 | 0 | 1,852 | 292 | 1964 | 1,605 | 569 | 5,600 | 6,625 | 36 | 62,872 | 17 | 21 | 5 | 11 | 19 | 5 | 15 | 1 | 59 | 33 | 88 | 12 | 67 | 22 | 3 | 7 | 1 | 11 | 0.8 | 79 | 8 | 1 | 13 | 5 | 7 | 89 |
| FAR SOUTHWEST | 570,000 | 675,784 | 27 | -13 | 4 | 56 | 0 | 0 | 0 | 2,319 | 291 | 1982 | 1,938 | - | 2,065 | 3,470 | 53 | 99,152 | 72 | 6 | 3 | 19 | 53 | 4 | 15 | 1 | 28 | 35 | 87 | 13 | 88 | 3 | 6 | 2 | 0 | 9 | 0.6 | 3 | 1 | 3 | 3 | 1 | 3 | 38 |
| FOREST PARK* | 951,000 | 1,090,381 | 30 | -25 | 4 | 81 | 0 | 0 | 0 | 3,441 | 317 | 1990 | 1,941 | - | 1,892 | 184 | 45 | 171,236 | 85 | 5 | 5 | 27 | 53 | 3 | 12 | 0 | 32 | 35 | 85 | 15 | 90 | 7 | 1 | 1 | 0 | 3 | 10.3 | 1 | 15 | 74 | 1 | 1 | 3 | 4 |
| FOSTER-POWELL | 454,900 | 470,069 | 94 | -2 | 6 | 45 | 4 | 0 | 1 | 1,540 | 305 | 1952 | 1,691 | 157 | 8,065 | 9,064 | 41 | 93,339 | 60 | 10 | 6 | 22 | 41 | 4 | 12 | 1 | 41 | 30 | 81 | 19 | 89 | 7 | 1 | 2 | 1 | 4 | 0.9 | 89 | 4 | 1 | 7 | 5 | 1 | 86 |
| GLENFAIR | 398,000 | 381,148 | 21 | -8 | 17 | 66 | 5 | 0 | 2 | 1,553 | 245 | 1962 | 1,331 | 149 | 2,719 | 8,568 | 38 | 58,252 | 43 | 19 | 1 | 25 | 33 | 9 | 12 | 2 | 44 | 16 | 63 | 37 | 89 | 6 | 2 | 3 | 0 | 5 | 0.3 | 25 | 3 | 2 | 10 | 0 | 2 | 61 |
| GOOSE HOLLOW | 285,000 | 417,931 | 65 | -16 | -13 | 112 | 89 | 0 | 0 | 1,441 | 290 | 1979 | 1,547 | 525 | 5,860 | 17,280 | 38 | 81,039 | 29 | 16 | 5 | 9 | 28 | 2 | 11 | 1 | 58 | 36 | 85 | 15 | 70 | 14 | 5 | 9 | 2 | 16 | 0.3 | 72 | 2 | 1 | 16 | 2 | 15 | 94 |
| GRANT PARK | 886,000 | 910,058 | 40 | 5 | 16 | 12 | 0 | 0 | 0 | 2,605 | 349 | 1926 | 2,233 | - | 3,746 | 8,209 | 44 | 137,748 | 78 | 7 | 5 | 28 | 56 | 3 | 10 | 0 | 31 | 43 | 88 | 12 | 86 | 10 | 2 | 2 | 0 | 4 | 0.5 | 98 | 2 | 7 | 3 | 6 | 3 | 84 |
| HAYDEN ISLAND | 385,000 | 391,527 | 61 | 15 | 3 | 98 | 43 | 0 | 2 | 1,533 | 255 | 1983 | 2,583 | - | 2,372 | 1,716 | 55 | 64,306 | 80 | 11 | 5 | 9 | 45 | 8 | 22 | 0 | 26 | 21 | 87 | 13 | 91 | 3 | 2 | 3 | 0 | 6 | 1.4 | 6 | 2 | 0 | 1 | 0 | 2 | 36 |
| HAYHURST | 610,500 | 623,928 | 74 | -8 | 15 | 47 | 5 | 0 | 0 | 1,939 | 322 | 1959 | 1,597 | 14 | 5,652 | 4,951 | 44 | 118,380 | 60 | 7 | 3 | 28 | 51 | 5 | 12 | 1 | 31 | 42 | 87 | 13 | 89 | 5 | 4 | 1 | 1 | 6 | 1.1 | 10 | 5 | 8 | 5 | 0 | 1 | 52 |
| HAZELWOOD | 410,000 | 390,862 | 207 | -1 | 17 | 44 | 20 | 0 | 4 | 1,506 | 260 | 1973 | 1,411 | 1,839 | 24,617 | 6,017 | 38 | 60,212 | 48 | 19 | 6 | 27 | 36 | 5 | 15 | 2 | 42 | 21 | 71 | 29 | 85 | 10 | 2 | 2 | 1 | 5 | 4.1 | 38 | 26 | 2 | 11 | 1 | 3 | 64 |
| HEALY HEIGHTS | 1,420,000 | 1,420,000 | 2 | 54 | 14 | 157 | 0 | 0 | 0 | 3,635 | 391 | 1955 | 1,487 | - | 193 | 3,277 | 39 | 129,338 | 51 | 7 | 2 | 29 | 53 | 4 | 13 | 1 | 29 | 36 | 86 | 14 | 83 | 9 | 2 | 4 | 1 | 7 | 0.1 | 3 | - | 3 | 5 | 1 | 14 | 13 |
| HILLSDALE | 765,000 | 795,059 | 112 | 13 | 25 | 63 | 8 | 0 | 1 | 2,528 | 315 | 1962 | 1,535 | 100 | 7,764 | 4,146 | 43 | 130,759 | 67 | 7 | 2 | 25 | 54 | 3 | 11 | 1 | 31 | 42 | 90 | 10 | 86 | 7 | 2 | 4 | 1 | 7 | 1.9 | 12 | 9 | 6 | 6 | 1 | 5 | 57 |
| HILLSIDE | 1,052,500 | 1,107,251 | 56 | 14 | 21 | 90 | 39 | 1 | 0 | 2,964 | 374 | 1966 | 1,831 | - | 1,303 | 1,882 | 48 | 199,721 | 82 | 4 | 5 | 26 | 68 | 2 | 5 | 0 | 25 | 38 | 84 | 16 | 85 | 10 | 3 | 2 | 1 | 6 | 0.7 | 18 | - | 29 | 1 | 1 | 8 | 47 |
| HOLLYWOOD | 555,000 | 587,558 | 12 | -11 | -6 | 27 | 33 | 0 | 0 | 2,125 | 277 | 1958 | 1,592 | 353 | 2,324 | 9,816 | 44 | 98,996 | 48 | 9 | 5 | 22 | 44 | 2 | 17 | 0 | 37 | 46 | 86 | 14 | 86 | 7 | 1 | 5 | 1 | 7 | 0.2 | 93 | 2 | 0 | 10 | 2 | 3 | 94 |
| HOMESTEAD | 452,500 | 516,906 | 16 | -7 | -5 | 54 | 25 | 0 | 0 | 1,659 | 312 | 1946 | 1,517 | - | 2,242 | 2,760 | 41 | 123,115 | 52 | 6 | 2 | 25 | 47 | 3 | 13 | 1 | 36 | 41 | 87 | 13 | 76 | 16 | 2 | 5 | 1 | 8 | 0.8 | 16 | 4 | 49 | 5 | 1 | 12 | 47 |
| HOSFORD-ABERNETHY | 710,000 | 729,803 | 125 | 9 | 5 | 42 | 21 | 0 | 0 | 2,175 | 336 | 1948 | 1,716 | 39 | 8,376 | 6,440 | 39 | 105,724 | 43 | 12 | 8 | 15 | 37 | 2 | 10 | 1 | 50 | 36 | 92 | 8 | 81 | 11 | 3 | 5 | 0 | 8 | 1.3 | 89 | 11 | 0 | 7 | 9 | 5 | 92 |
| HUMBOLDT | 440,000 | 494,118 | 81 | -18 | -20 | 80 | 42 | 0 | 1 | 1,656 | 298 | 1969 | 1,557 | 582 | 4,820 | 8,767 | 38 | 99,644 | 49 | 15 | 5 | 19 | 33 | 4 | 12 | 1 | 49 | 43 | 88 | 12 | 83 | 9 | 1 | 6 | 1 | 8 | 0.5 | 95 | 4 | 0 | 7 | 7 | 3 | 89 |
| IRVINGTON | 875,000 | 916,210 | 61 | 0 | 11 | 26 | 16 | 0 | 0 | 2,781 | 329 | 1928 | 2,326 | 236 | 6,097 | 9,373 | 41 | 137,817 | 58 | 6 | 5 | 22 | 46 | 5 | 10 | 1 | 38 | 39 | 89 | 11 | 79 | 13 | 3 | 5 | 0 | 8 | 0.7 | 100 | 3 | 4 | 7 | 7 | 3 | 84 |
| KENTON | 479,500 | 487,460 | 122 | 4 | 6 | 50 | 16 | 0 | 0 | 1,593 | 306 | 1972 | 1,724 | 457 | 7,970 | 2,321 | 40 | 92,302 | 63 | 13 | 2 | 25 | 40 | 3 | 16 | 1 | 40 | 32 | 73 | 27 | 83 | 10 | 2 | 5 | 0 | 7 | 3.4 | 46 | 13 | 6 | 7 | 1 | 1 | 73 |
| KERNS | 676,700 | 668,259 | 34 | 7 | 22 | 26 | 29 | 0 | 0 | 2,164 | 309 | 1945 | 1,522 | 416 | 7,147 | 8,648 | 35 | 69,664 | 16 | 13 | 7 | 6 | 27 | 2 | 11 | 1 | 59 | 40 | 83 | 17 | 68 | 16 | 2 | 12 | 1 | 15 | 0.8 | 91 | 6 | 3 | 7 | 7 | 15 | 94 |
| KING | 599,000 | 589,708 | 91 | 6 | 9 | 42 | 20 | 0 | 1 | 1,864 | 316 | 1946 | 1,845 | 584 | 7,047 | 11,370 | 35 | 104,987 | 49 | 11 | 6 | 23 | 33 | 2 | 11 | 1 | 52 | 36 | 86 | 14 | 77 | 13 | 3 | 6 | 1 | 10 | 0.6 | 97 | 1 | 1 | 12 | 7 | 2 | 89 |
| LAURELHURST | 911,040 | 983,351 | 61 | 1 | 11 | 30 | 0 | 0 | 1 | 3,203 | 307 | 1925 | 1,410 | - | 4,911 | 7,354 | 46 | 178,890 | 83 | 3 | 3 | 36 | 60 | 2 | 9 | 0 | 29 | 36 | 93 | 7 | 89 | 5 | 2 | 5 | 0 | 6 | 0.7 | 91 | 3 | 8 | 2 | 5 | 7 | 82 |
| LENTS | 404,500 | 416,350 | 202 | 1 | 17 | 47 | 5 | 2 | 4 | 1,519 | 274 | 1958 | 1,555 | 864 | 21,405 | 6,004 | 37 | 74,979 | 54 | 17 | 6 | 32 | 38 | 5 | 15 | 2 | 41 | 20 | 74 | 26 | 84 | 8 | 5 | 3 | 0 | 8 | 3.6 | 46 | 18 | 9 | 6 | 2 | 2 | 61 |
| LINNTON* | 439,125 | 483,096 | 12 | -8 | 2 | 24 | 25 | 0 | 0 | 1,911 | 253 | 1957 | 1,468 | - | 149 | 104 | 43 | 114,699 | 82 | 7 | 4 | 21 | 38 | 2 | 17 | 0 | 42 | 30 | 92 | 8 | 91 | 8 | 1 | 0 | 0 | 1 | 1.4 | 2 | 6 | 7 | 1 | 2 | 3 | 4 |
| LLOYD DISTRICT | 220,000 | 230,000 | 3 | -20 | 5 | 75 | 100 | 0 | 0 | 638 | 361 | 1977 | 1,668 | 745 | 2,917 | 5,697 | 39 | 52,400 | 12 | 25 | 7 | 6 | 18 | 7 | 17 | 1 | 58 | 33 | 86 | 14 | 67 | 21 | 4 | 8 | 1 | 12 | 0.5 | 79 | 8 | 1 | 16 | 6 | 9 | 91 |
| MADISON SOUTH | 461,100 | 455,448 | 66 | 7 | 18 | 49 | 6 | 0 | 0 | 1,672 | 272 | 1955 | 1,512 | 649 | 8,277 | 4,712 | 41 | 91,205 | 60 | 12 | 5 | 28 | 33 | 4 | 18 | 1 | 44 | 24 | 86 | 14 | 91 | 7 | 0 | 1 | 0 | 2 | 1.8 | 36 | 3 | 11 | 9 | 3 | 6 | 57 |
| MAPLEWOOD | 640,000 | 657,221 | 41 | 16 | 25 | 45 | 5 | 0 | 0 | 2,020 | 325 | 1961 | 1,916 | - | 2,684 | 4,335 | 45 | 115,372 | 79 | 2 | 4 | 21 | 54 | 5 | 14 | 0 | 26 | 45 | 88 | 12 | 89 | 5 | 3 | 2 | 1 | 6 | 0.6 | 1 | 4 | 3 | 2 | 1 | 1 | 34 |
| MARKHAM | 569,950 | 584,309 | 30 | -3 | 9 | 30 | 0 | 0 | 0 | 1,948 | 300 | 1969 | 1,961 | - | 1,868 | 3,598 | 44 | 147,498 | 87 | 5 | 4 | 33 | 60 | 4 | 11 | 0 | 25 | 43 | 89 | 11 | 92 | 4 | 2 | 2 | 0 | 3 | 0.5 | 4 | 1 | 3 | 1 | 1 | 1 | 42 |
| MARSHALL PARK | 752,500 | 792,113 | 28 | 5 | 31 | 52 | 0 | 0 | 0 | 2,670 | 297 | 1980 | 1,908 | - | 1,483 | 2,429 | 40 | 162,295 | 90 | 3 | 3 | 36 | 61 | 4 | 8 | 0 | 27 | 40 | 86 | 14 | 90 | 5 | 2 | 4 | 0 | 5 | 0.6 | 3 | - | 17 | 1 | 1 | 3 | 28 |
| MILL PARK | 420,000 | 406,077 | 75 | 5 | 20 | 36 | 20 | 0 | 0 | 1,594 | 255 | 1968 | 1,419 | 209 | 8,813 | 8,712 | 40 | 63,095 | 48 | 26 | 6 | 29 | 36 | 5 | 15 | 3 | 41 | 15 | 63 | 37 | 86 | 5 | 3 | 2 | 3 | 9 | 1.0 | 31 | 5 | 3 | 12 | 1 | 2 | 70 |
| MONTAVILLA | 425,000 | 449,637 | 219 | -2 | 4 | 48 | 16 | 1 | 1 | 1,573 | 286 | 1956 | 1,600 | 78 | 16,198 | 7,436 | 40 | 86,806 | 68 | 11 | 7 | 27 | 41 | 3 | 12 | 2 | 42 | 37 | 81 | 19 | 81 | 13 | 3 | 3 | 1 | 6 | 2.2 | 61 | 12 | 2 | 10 | 5 | 2 | 76 |
| MOUNT SCOTT-ARLETA | 438,000 | 453,969 | 104 | -2 | 8 | 27 | 6 | 0 | 0 | 1,423 | 319 | 1935 | 1,700 | 259 | 7,666 | 8,875 | 38 | 97,909 | 67 | 9 | 4 | 24 | 37 | 4 | 13 | 2 | 45 | 34 | 87 | 13 | 85 | 8 | 3 | 3 | 1 | 7 | 0.9 | 85 | 5 | 2 | 8 | 3 | 1 | 80 |
| MOUNT TABOR | 750,000 | 783,319 | 139 | 2 | 24 | 28 | 10 | 0 | 0 | 2,499 | 313 | 1946 | 1,502 | 37 | 11,440 | 7,158 | 43 | 109,522 | 66 | 6 | 5 | 24 | 48 | 4 | 10 | 1 | 38 | 38 | 87 | 13 | 84 | 10 | 1 | 4 | 0 | 6 | 1.6 | 70 | 7 | 17 | 6 | 6 | 3 | 69 |
| MULTNOMAH | 625,000 | 628,527 | 127 | 4 | 34 | 42 | 26 | 0 | 1 | 1,927 | 326 | 1977 | 1,497 | 201 | 8,770 | 6,078 | 41 | 92,260 | 48 | 11 | 5 | 21 | 39 | 4 | 16 | 1 | 40 | 35 | 90 | 10 | 84 | 8 | 6 | 2 | 0 | 8 | 1.4 | 10 | 6 | 12 | 9 | 1 | 5 | 70 |
| NORTH TABOR | 565,000 | 557,290 | 59 | 26 | 14 | 38 | 7 | 0 | 0 | 1,870 | 298 | 1951 | 1,396 | 544 | 5,374 | 9,183 | 41 | 87,910 | 42 | 14 | 5 | 16 | 39 | 4 | 14 | 2 | 41 | 31 | 89 | 11 | 82 | 12 | 1 | 5 | 0 | 6 | 0.6 | 81 | 2 | 1 | 7 | 3 | 3 | 77 |
| NORTHWEST DISTRICT | 525,000 | 628,375 | 144 | 15 | 6 | 78 | 71 | 0 | 2 | 1,734 | 362 | 1951 | 1,671 | 841 | 16,561 | 11,376 | 36 | 89,984 | 27 | 11 | 5 | 9 | 27 | 1 | 16 | 1 | 55 | 39 | 86 | 13 | 66 | 15 | 8 | 8 | 3 | 19 | 1.5 | 79 | 12 | 2 | 6 | 8 | 13 | 93 |
| NORTHWEST HEIGHTS | 875,000 | 897,725 | 92 | -5 | 24 | 77 | 15 | 0 | 0 | 3,277 | 274 | 2001 | 2,274 | - | 5,449 | 4,000 | 44 | 197,207 | 88 | 2 | 2 | 34 | 66 | 1 | 7 | 0 | 25 | 42 | 74 | 26 | 89 | 3 | 4 | 4 | 0 | 8 | 1.4 | 14 | - | 0 | 0 | 0 | 0 | 12 |
| OLD TOWN-CHINATOWN | 240,000 | 241,392 | 12 | 4 | -4 | 118 | 100 | 1 | 1 | 834 | 289 | 1985 | 990 | 2,083 | 3,516 | 12,529 | 43 | 32,009 | 18 | 43 | 6 | 5 | 20 | 2 | 18 | 4 | 56 | 18 | 87 | 13 | 65 | 21 | 6 | 8 | 1 | 14 | 0.3 | 81 | 6 | 6 | 17 | 2 | 25 | 97 |
| OVERLOOK | 572,750 | 581,103 | 104 | 7 | 15 | 36 | 12 | 1 | 0 | 1,966 | 296 | 1947 | 1,725 | 139 | 7,837 | 7,712 | 36 | 104,695 | 52 | 9 | 6 | 19 | 30 | 3 | 13 | 1 | 50 | 43 | 89 | 9 | 82 | 9 | 2 | 4 | 1 | 7 | 1.0 | 42 | 12 | 4 | 6 | 7 | 3 | 74 |
| PARKROSE | 330,000 | 347,326 | 47 | -18 | -6 | 36 | 43 | 0 | 1 | 1,359 | 256 | 1976 | 1,362 | 55 | 5,411 | 2,693 | 39 | 58,520 | 54 | 22 | 9 | 29 | 27 | 4 | 15 | 4 | 51 | 14 | 75 | 25 | 75 | 10 | 9 | 5 | 1 | 15 | 2.0 | 21 | 9 | 0 | 9 | 1 | 5 | 56 |
| PARKROSE HEIGHTS | 454,500 | 454,780 | 53 | 10 | 26 | 30 | 0 | 0 | 1 | 1,592 | 286 | 1956 | 1,471 | 1 | 6,021 | 6,184 | 43 | 79,346 | 69 | 5 | 6 | 35 | 41 | 5 | 18 | 4 | 32 | 24 | 64 | 36 | 89 | 8 | 1 | 1 | 0 | 3 | 1.0 | 31 | 5 | 2 | 9 | 1 | 3 | 60 |
| PEARL | 420,000 | 509,847 | 179 | -6 | -7 | 120 | 99 | 0 | 0 | 1,209 | 422 | 1992 | 1,881 | 1,333 | 10,192 | 22,882 | 39 | 122,292 | 27 | 11 | 2 | 4 | 33 | 1 | 11 | 2 | 53 | 38 | 86 | 14 | 71 | 15 | 2 | 13 | 0 | 14 | 0.4 | 93 | 5 | 3 | 7 | 0 | 11 | 98 |
| PIEDMONT | 567,500 | 568,439 | 81 | 5 | 26 | 40 | 0 | 0 | 1 | 1,961 | 290 | 1942 | 1,646 | 264 | 7,230 | 7,503 | 39 | 96,085 | 54 | 14 | 8 | 19 | 37 | 7 | 12 | 1 | 42 | 36 | 86 | 14 | 84 | 9 | 2 | 5 | 0 | 7 | 1.0 | 86 | 5 | 6 | 8 | 3 | 2 | 73 |
| PLEASANT VALLEY* | 560,000 | 544,390 | 124 | -2 | 25 | 51 | 7 | 0 | 1 | 2,257 | 241 | 1993 | 1,827 | 71 | 12,775 | 2,886 | 40 | 91,830 | 78 | 12 | 3 | 40 | 57 | 5 | 7 | 2 | 30 | 19 | 64 | 36 | 87 | 8 | 4 | 1 | 0 | 5 | 4.4 | 26 | 4 | 37 | 3 | 0 | 2 | 22 |
| PORTSMOUTH | 464,058 | 465,310 | 92 | 5 | 13 | 32 | 9 | 0 | 1 | 1,478 | 315 | 1969 | 1,395 | 1,192 | 9,970 | 9,166 | 34 | 85,872 | 55 | 27 | 7 | 25 | 35 | 2 | 13 | 0 | 49 | 26 | 80 | 20 | 87 | 9 | 1 | 3 | 0 | 4 | 1.1 | 84 | 7 | 9 | 8 | 3 | 1 | 62 |
| POWELLHURST-GILBERT | 398,000 | 381,021 | 178 | 8 | 24 | 57 | 16 | 0 | 4 | 1,497 | 255 | 1975 | 1,491 | 734 | 24,706 | 7,194 | 38 | 68,271 | 56 | 18 | 6 | 36 | 40 | 4 | 13 | 2 | 40 | 15 | 64 | 36 | 87 | 7 | 2 | 2 | 1 | 6 | 3.4 | 20 | 20 | 6 | 7 | 1 | 2 | 54 |
| REED | 650,000 | 668,315 | 31 | 8 | 17 | 33 | 10 | 0 | 0 | 2,052 | 326 | 1964 | 1,602 | 156 | 2,840 | 6,154 | 33 | 81,318 | 47 | 12 | 7 | 21 | 33 | 3 | 16 | 1 | 48 | 32 | 91 | 9 | 77 | 13 | 4 | 5 | 1 | 10 | 0.5 | 45 | 1 | 0 | 11 | 3 | 10 | 61 |
| RICHMOND | 644,500 | 659,355 | 150 | 6 | 7 | 34 | 13 | 0 | 1 | 2,060 | 320 | 1944 | 1,774 | 107 | 12,789 | 10,057 | 39 | 116,432 | 56 | 8 | 4 | 22 | 42 | 2 | 11 | 1 | 44 | 38 | 91 | 9 | 85 | 10 | 1 | 4 | 1 | 5 | 1.3 | 94 | 4 | 1 | 6 | 11 | 4 | 91 |
| ROSE CITY PARK | 665,000 | 685,854 | 123 | 11 | 16 | 26 | 1 | 0 | 0 | 2,296 | 299 | 1931 | 1,545 | 37 | 10,333 | 8,633 | 44 | 121,271 | 74 | 7 | 4 | 28 | 49 | 3 | 13 | 1 | 34 | 41 | 88 | 12 | 90 | 7 | 2 | 2 | 0 | 4 | 1.2 | 89 | 6 | 3 | 7 | 4 | 3 | 78 |
| ROSEWAY | 526,500 | 536,019 | 98 | -3 | 15 | 22 | 0 | 0 | 1 | 1,777 | 302 | 1939 | 1,864 | 55 | 5,798 | 6,887 | 41 | 104,373 | 71 | 5 | 5 | 20 | 41 | 3 | 18 | 1 | 38 | 37 | 90 | 10 | 90 | 8 | 0 | 1 | 0 | 2 | 0.8 | 73 | 3 | 1 | 6 | 3 | 3 | 78 |
| RUSSELL | 450,000 | 469,734 | 41 | -6 | 13 | 35 | 0 | 0 | 1 | 1,948 | 241 | 1958 | 1,839 | - | 3,777 | 4,730 | 51 | 76,562 | 86 | 11 | 2 | 20 | 48 | 12 | 13 | 1 | 27 | 24 | 79 | 21 | 90 | 6 | 3 | 0 | 0 | 3 | 0.8 | 46 | 4 | 3 | 4 | 0 | 1 | 38 |
| SABIN | 715,000 | 766,385 | 61 | -11 | 4 | 35 | 0 | 0 | 1 | 2,242 | 342 | 1950 | 2,223 | 27 | 5,300 | 11,263 | 38 | 141,263 | 66 | 8 | 6 | 27 | 41 | 3 | 11 | 1 | 43 | 35 | 87 | 13 | 81 | 9 | 2 | 7 | 0 | 10 | 0.5 | 98 | 1 | 1 | 8 | 10 | 3 | 83 |
| SELLWOOD-MORELAND | 660,000 | 677,699 | 183 | 2 | 16 | 46 | 21 | 1 | 1 | 1,960 | 346 | 1959 | 1,667 | 523 | 10,992 | 5,284 | 40 | 85,099 | 52 | 10 | 7 | 24 | 43 | 3 | 12 | 1 | 41 | 38 | 91 | 9 | 83 | 7 | 2 | 8 | 0 | 10 | 2.1 | 79 | 10 | 23 | 5 | 7 | 6 | 81 |
| SOUTH BURLINGAME | 639,000 | 654,446 | 28 | 3 | 12 | 47 | 4 | 0 | 0 | 2,201 | 297 | 1962 | 2,049 | - | 1,955 | 4,600 | 44 | 128,274 | 83 | 8 | 6 | 28 | 52 | 3 | 14 | 0 | 31 | 49 | 94 | 6 | 92 | 4 | 3 | 1 | 0 | 4 | 0.4 | 31 | 2 | 5 | 2 | 1 | 2 | 63 |
| SOUTH PORTLAND | 524,250 | 596,800 | 140 | 0 | 13 | 82 | 57 | 1 | 0 | 1,653 | 361 | 1983 | 1,782 | 272 | 10,704 | 6,287 | 37 | 101,481 | 42 | 12 | 4 | 13 | 35 | 4 | 15 | 1 | 45 | 39 | 88 | 12 | 70 | 18 | 5 | 6 | 0 | 12 | 1.7 | 51 | 11 | 6 | 7 | 3 | 11 | 72 |
| SOUTH TABOR | 535,000 | 527,414 | 78 | 4 | 11 | 44 | 9 | 0 | 1 | 1,781 | 296 | 1951 | 1,670 | 29 | 6,842 | 8,562 | 41 | 103,361 | 63 | 4 | 5 | 27 | 44 | 0 | 12 | 1 | 43 | 31 | 82 | 18 | 86 | 9 | 3 | 1 | 1 | 5 | 0.8 | 75 | 4 | 2 | 5 | 4 | 2 | 76 |
| SOUTHWEST HILLS* | 1,050,000 | 1,143,910 | 111 | 5 | 24 | 97 | 8 | 1 | 0 | 3,344 | 342 | 1953 | 1,836 | - | 6,766 | 3,504 | 42 | 161,556 | 64 | 7 | 3 | 29 | 58 | 3 | 9 | 1 | 29 | 38 | 88 | 12 | 83 | 8 | 3 | 5 | 1 | 8 | 1.9 | 24 | 4 | 14 | 4 | 1 | 9 | 32 |
| ST. JOHNS | 445,000 | 439,925 | 167 | 0 | 11 | 54 | 13 | 1 | 3 | 1,426 | 309 | 1967 | 1,695 | 540 | 13,970 | 1,271 | 38 | 81,557 | 60 | 15 | 3 | 26 | 39 | 3 | 15 | 1 | 41 | 29 | 70 | 30 | 83 | 10 | 1 | 5 | 0 | 7 | 11.0 | 39 | 19 | 31 | 7 | 1 | 1 | 63 |
| SULLIVAN'S GULCH | 320,000 | 433,088 | 17 | 7 | -26 | 107 | 76 | 0 | 0 | 1,505 | 288 | 1949 | 1,653 | 51 | 3,099 | 9,716 | 37 | 82,202 | 32 | 11 | 7 | 10 | 32 | 3 | 14 | 0 | 51 | 42 | 90 | 10 | 67 | 23 | 5 | 4 | 1 | 9 | 0.3 | 90 | 3 | 2 | 7 | 10 | 4 | 81 |
| SUMNER | 419,000 | 418,695 | 20 | 0 | 24 | 40 | 0 | 1 | 0 | 1,317 | 318 | 1936 | 1,461 | - | 1,994 | 2,554 | 39 | 64,329 | 65 | 21 | 9 | 26 | 21 | 4 | 15 | 3 | 57 | 19 | 74 | 26 | 72 | 15 | 8 | 4 | 1 | 13 | 0.8 | 13 | 2 | 3 | 7 | 2 | 5 | 65 |
| SUNDERLAND | 443,000 | 443,000 | 1 | 15 | 37 | 5 | 0 | 0 | 0 | 1,482 | 299 | 1941 | 1,506 | - | 318 | 171 | 37 | 60,641 | 56 | 25 | 9 | 32 | 22 | 4 | 17 | 3 | 53 | 13 | 71 | 29 | 69 | 14 | 12 | 5 | 1 | 18 | 1.9 | 10 | 4 | 5 | 8 | 0 | 6 | 12 |
| SUNNYSIDE | 575,000 | 604,596 | 79 | 6 | 4 | 40 | 27 | 0 | 0 | 1,892 | 320 | 1937 | 1,746 | 113 | 7,928 | 13,270 | 38 | 98,923 | 43 | 12 | 6 | 14 | 32 | 3 | 14 | 1 | 50 | 44 | 92 | 8 | 77 | 13 | 4 | 6 | 0 | 10 | 0.6 | 97 | 3 | 0 | 8 | 9 | 4 | 93 |
| SYLVAN-HIGHLANDS | 808,250 | 792,822 | 22 | -3 | 15 | 66 | 23 | 0 | 0 | 2,466 | 322 | 1972 | 2,267 | - | 1,393 | 1,840 | 45 | 208,418 | 83 | 7 | 2 | 33 | 70 | 1 | 7 | 0 | 22 | 42 | 90 | 10 | 81 | 6 | 8 | 5 | 0 | 13 | 0.8 | 2 | 2 | 15 | 1 | 2 | 3 | 19 |
| UNIVERSITY PARK | 571,000 | 549,310 | 71 | 10 | 10 | 52 | 7 | 0 | 0 | 1,918 | 286 | 1962 | 1,969 | 15 | 6,862 | 5,356 | 23 | 108,573 | 71 | 17 | 5 | 20 | 29 | 2 | 5 | 2 | 59 | 29 | 87 | 10 | 75 | 9 | 4 | 7 | 2 | 14 | 1.3 | 75 | 4 | 3 | 3 | 5 | 16 | 54 |
| VERNON | 535,000 | 587,709 | 42 | -15 | -11 | 48 | 12 | 0 | 1 | 1,808 | 325 | 1946 | 1,897 | 112 | 2,709 | 8,740 | 38 | 126,624 | 64 | 8 | 5 | 25 | 42 | 2 | 11 | 1 | 43 | 39 | 91 | 9 | 84 | 8 | 2 | 5 | 1 | 8 | 0.3 | 91 | - | 8 | 7 | 8 | 4 | 90 |
| WEST PORTLAND PARK | 580,000 | 578,450 | 49 | 3 | 28 | 31 | 8 | 0 | 0 | 1,814 | 319 | 1977 | 1,586 | - | 4,231 | 5,800 | 37 | 93,464 | 55 | 8 | 0 | 29 | 47 | 4 | 8 | 2 | 40 | 35 | 81 | 19 | 91 | 3 | 5 | 1 | 0 | 5 | 0.7 | 12 | 2 | 8 | 8 | 1 | 2 | 57 |
| WILKES | 450,000 | 435,099 | 153 | -3 | 20 | 60 | 23 | 1 | 2 | 1,721 | 253 | 1979 | 1,518 | 64 | 9,052 | 2,937 | 44 | 85,467 | 69 | 14 | 5 | 29 | 42 | 7 | 12 | 1 | 38 | 19 | 66 | 34 | 91 | 6 | 2 | 1 | 0 | 2 | 3.1 | 44 | 16 | 10 | 3 | 0 | 2 | 30 |
| WOODLAND PARK | 387,000 | 387,000 | 1 | -15 | 1 | 86 | 0 | 0 | 0 | 1,624 | 238 | 1945 | 1,747 | - | 297 | 6,190 | 39 | 76,875 | 67 | 5 | 6 | 40 | 33 | 6 | 23 | 3 | 35 | 27 | 64 | 36 | 85 | 11 | 1 | 1 | 1 | 3 | 0.0 | 24 | 1 | 0 | 14 | 1 | 2 | 69 |
| WOODLAWN | 539,000 | 544,426 | 74 | 19 | 11 | 30 | 7 | 0 | 0 | 1,665 | 327 | 1956 | 1,746 | 50 | 5,290 | 7,225 | 39 | 110,456 | 65 | 7 | 4 | 23 | 47 | 2 | 10 | 1 | 40 | 39 | 90 | 10 | 88 | 6 | 2 | 4 | 1 | 6 | 0.7 | 79 | 3 | 2 | 8 | 6 | 3 | 74 |
| WOODSTOCK | 560,725 | 571,234 | 136 | 4 | 13 | 34 | 7 | 0 | 1 | 1,710 | 334 | 1963 | 2,162 | 4 | 8,816 | 7,072 | 40 | 129,043 | 76 | 8 | 6 | 30 | 52 | 3 | 9 | 1 | 35 | 37 | 92 | 8 | 82 | 9 | 5 | 4 | 0 | 9 | 1.2 | 73 | 4 | 2 | 6 | 5 | 4 | 74 |
| X-PORTLAND TOTAL | 515,000 | 581,701 | 7,354 | 3 | 22 | 52 | 19 | 21 | 58 | 1,884 | 309 | 1962 | 1,596 | 12,378 | 642,715 | 4,430 | 39 | 88,792 | 53 | 13 | 6 | 22 | 40 | 4 | 13 | 1 | 43 | 32 | 82 | 18 | 82 | 10 | 3 | 4 | 1 | 8 | 145 | 49 | 575 | 15 | 5 | 7 | 4 | 67 |
Methodology
Neighborhood Boundaries represent records maintained by the city as of January 2026. Boundary conflicts were resolved for statistical purposes only. Due to overlap between certain neighborhoods, boundary definitions may vary occasionally across categories. With the exception of the area unofficially (but universally) known as Dunthorpe, unclaimed sections of Multnomah County were excluded. *Neighborhood boundary extends beyond city limits; only data within city limits calculated.
Real Estate 2025 data from the Regional Multiple Listing Service with analysis by the Center for Spatial Analysis and Research at Portland State University’s Department of Geography. Additional info from Metro and other sources. Figures were rounded for legibility. In areas with very few home sales, such as Lloyd, Healy Heights, and Sunderland, year-to-year change can appear exaggerated.
People Data for all “people” columns, rent costs, and commuting from the US Census Bureau’s American Community Survey 5-Year Estimates 2019–2023, released in late 2024. The ACS data are estimates only, and accuracy varies by attribute.
Rent Costs Calculated from all renter-occupied units. Estimated median rent is not adjusted for unit size or number of occupants. Figure includes estimated monthly utility costs.
Median Income The Census defines household as including “all the persons who occupy a housing unit as their usual place of residence.” Thus living situations in this estimate range from individuals to large households.
Sidewalks The figure is the percentage of total centerline miles of roadway that have full sidewalk coverage, as opposed to only partial sidewalk coverage or no sidewalk coverage.
Parks Data from Metro and/or individual cities.
Transit Information from TriMet.
Walk Score Data from WalkScore.com, now a part of real estate agency Redfin. This score reflects, on a scale of 1 to 100, a neighborhood’s pedestrian-friendliness based on distances to amenities such as grocery stores and other routine destinations. For some cities and neighborhoods with a commercial central point or a large nonresidential area (such as Forest Park), the score was taken from a point in a central residential portion.
Unavailable Data is noted with a dash (—).
Real estate and other analysis by Alyssa Schaer, Ethan Morehouse, and David Banis of PSU’s Center for Spatial Analysis and Research.