The 2008 Northwest College Report
PICKING A COLLEGE IS A TWO WAY STREET: You’re the one filling out the application, but the school’s got to meet your criteria, too. And we’re not just talking about SAT scores and financial aid packages. We mean those less quantifiable campus-life kinds of things. For some, that might be a school that’s committed to keeping our planet healthy, and for others, it might be having a football team that’s worth waving a foam finger for. In our 2008 NW College Report, we look at nine qualities you might consider when picking a place to spend some of the best years of your life—such as professors, research opportunities, and just how likely you are to walk into your dream job once you graduate. We also offer our suggestions for those Pacific Northwest schools that might best fit the bill. Our picks are by no means the only options; they’re simply a place to start. Where you go from here? Well, that’s entirely up to you.
ACADEMICS – Liberal Arts Allstars
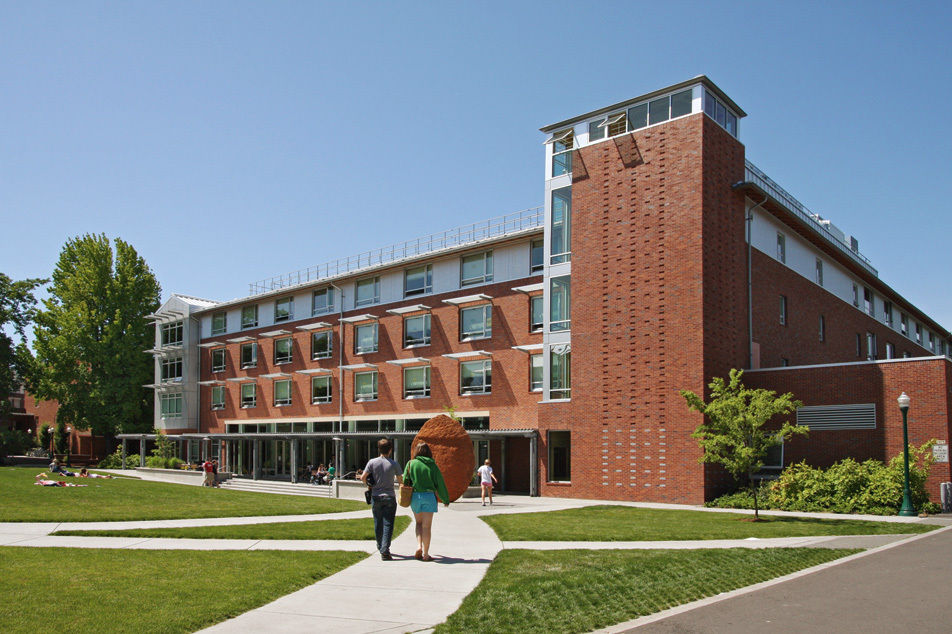
Whitman College
The Harper Joy Theater at Whitman College
Image: Matt Zimmerman
Walla Walla, Washington
Whitman College is an endangered species. According to a 2004 Carnegie Foundation report, the school is one of fewer than 100 in the country that have no graduate programs and grant more than 80 percent of their degrees in the liberal arts and sciences (as opposed to professional degrees like electrical engineering). Whitman College president George S. Bridges plans to keep it that way. “Liberal arts colleges offer great breadth over specialization,” he wrote in a June 2008 op-ed for the Baltimore Sun. “Our design and curriculum enrich the minds of our students, enhance their character, and stir their individual spirit.” It’s a lofty assertion, but one that appears to be supported by ample evidence. Last year, five seniors at this 1,452-student college were offered Fulbright scholarships. Nearly 50 percent of the student body studies abroad, and in 2007, the school ranked among the top 20 small colleges in sending students to the Peace Corps (perhaps they were inspired by 1971 Whitman alum Ryan Crocker, US Ambassador to Iraq). More important, undergrads seem to be remarkably happy with their choice of college: The freshman retention rate (the percent of freshmen who continue as sophomores) is a staggering 94 percent; at most other Northwest schools it’s closer to the mid 80s. “If I had to pick one thing that I value most about Whitman, it would be the support that I have here,” says Whitney Heyvaert, a senior biology major from Minnesota. “My professors are amazing. Why? Their enthusiasm for the subject and love for teaching and learning.” Seventy-three percent of classes have fewer than 20 students, and the required two-semester freshman course Modernity and Antiquity, which explores Western philosophy, religion, history, and literature, is capped at 16 students. Of course, Walla Walla’s intimate, rural setting might also have something to do with how close students feel to their professors. Set near the Blue Mountains, the town of 31,000 is more than an hour’s drive from the nearest “big” city, Kennewick (pop. 66,000). Which means you’re just as likely to see your English teacher at the local diner as you are on campus. And there’s a good chance she’ll invite you to join her.
Willamette University
Salem
As the oldest university in the Northwest, Willamette has had a long time to perfect the formula for delivering a top-notch liberal arts education (166 years, to be exact). That includes maintaining a student-to-faculty ratio of 10 to 1 and focusing on writing as a major component of the core curriculum (every student must take three writing-intensive courses to graduate). The formula seems to be working: Willamette regularly lands in US News & World Report’s America’s Best Colleges top tier for liberal arts schools, this year snagging the 60th spot.
Reed College
Portland
With its no-grades policy (grades are kept, but generally aren’t shared with a student unless he or she asks) and outlandish events like the annual Renn Fayre—an end-of-year celebration that’s included naked slip-and-slide, bug-eating contests, and human chess—Reed definitely puts the “liberal” in liberal arts education. And that dedication to thinking outside the box also is part of Reed’s academic culture, according to Bob Mahmoudi, founder and president of Seattle-based college counseling firm College Planning Solutions (collegeplanning.com). As a result, the school continues to turn out some of the country’s best minds—from C. Howard Vollum, co-founder of Tektronix; to Pulitzer Prize-winning poet Gary Snyder; to 1991 grad Larry Sanger, co-founder of a little website called Wikipedia—although most of them don’t have the grades to prove it. In the past 24 years, only seven students have graduated with a 4.0 grade point average.
ACADEMICS – Professorial Proving Grounds
University of Puget Sound
Harned Hall, a 51,000-square-foot interactive laboratory space that’s part of University of Puget Sound’s Science Center
Image: Lara Swimmer
Tacoma, Washington
When University of Puget Sound physics professor Bernard Bates learned that copyright issues barred him from screening a science-fiction film on the campus itself, he did something many university professors would never consider: He invited his entire class to watch it at his home. Of course, the fact that the class had only about 20 students made doing so a little more manageable. Small classes (the student-to-faculty ratio is 11 to 1) are a point of pride for the Tacoma liberal arts college—and a likely reason that the school ranks No. 17 on the Princeton Review’s list of schools with the most accessible professors.
“The small classes allow your relationship with the professor to grow,” says Sam Kussin-Shoptaw, a senior politics and government major whose largest class in four years had 31 students. Those relationships can have big payoffs. In 2006, one of Kussin-Shoptaw’s professors, who’d noticed his interest in politics, told him about an opportunity to work on Democrat Darcy Burner’s US Congressional campaign. The then-sophomore parlayed his volunteer position into a more permanent role with the Democratic Party, and this summer he attended the Democratic National Convention in Denver.
Kussin-Shoptaw also commends faculty members for their willingness to take time from their own research projects to help students. “Even outside of office hours, they’ll spend time with me,” he says. “I mean, they do what all professors do—they do their research and write their books—but mostly they’re here to teach first. They make us their No. 1 priority.” Which, after all, is how a university should be.
Lewis & Clark College
Portland
Most colleges boast a few rock-star professors whose research has thrust them into the national spotlight, but few higher-ed institutions actually let undergraduates get in on the action. At Lewis & Clark, researchers like Kellar Autumn—a biology professor whose discovery of how geckos cling to vertical walls has not only helped advance medicine, but also improved car brakes and even climbing shoes—and fellow biology professor Greta Binford, whose research on spider venom landed her a lengthy profile in the New Yorker, have invited students into the labs. There, students have done everything from measuring geckos’ steps as they crawl up a wall to “milking” spiders for their venom—a task that, understandably, isn’t for everyone.
University of Portland
Portland
“Our institution’s emphasis is on teaching first,” says John Furey, associate director of media relations at the University of Portland. That could well be why the faculty members at this North Portland school have collected so many awards for their instruction. Three professors have earned the Oregon Professor of the Year Award from the Carnegie Foundation since 1997. And in 2000, Spanish professor Kate Regan brought home the Carnegie Foundation’s US Professor of the Year award, which cited her contagious passion for the field (there were 5 Spanish majors when Regan arrived at the university in 1995; by 2000, there were 52) as one of the reasons for choosing her.
ACADEMICS – Rich in Research
The Evergreen State College
Olympia, Washington
To many people, the Grand Canyon is one of those iconic American places that makes an obligatory appearance in the family photo album alongside Yellowstone National Park and Disneyland. For some Evergreen students, however, the awe-inspiring gash in the earth is a classroom. Each year, students enrolled in Geology of the Grand Canyon spend the entire spring quarter floating down the Colorado River, exploring the landscape. “Faculty [members] don’t want to teach the same lecture every year to a class of students that is disengaged, sitting in a lecture hall,” says Doug Scrima, Evergreen’s director of admissions. So Evergreen integrates research into almost all of its courses.
Yearly percentage of Evergreen grads who get into one of their top two choices for graduate school: eighty-five.
Students working in the school’s Phage Laboratory, for example, found a naturally occurring bacteriophage (a cell that attacks bacteria) that destroys E. coli. Even better, they figured out how to suspend it in a liquid so that when, say, Southern California farmers wash their spinach crops after harvest, the cells can destroy a bacteria that could make consumers sick. “So much of what we do is hands-on,” says senior Ashley Jamison, who is focusing her course work on evolutionary biology. “It’s helpful to go out into the field and gain experience instead of just starting a job not knowing about the tools you are using or how to use them.” It’s also a pretty good way to assure yourself a spot in graduate school: Forty-seven percent of recent Evergreen alums have gone on to graduate programs, and about 85 percent of them get into their first or second choices, according to Scrima. “We actually have faculty from different graduate programs calling and asking for more of our students,” he says.
Central Washington University
Ellensburg, Washington
Primates who communicate via sign language aren’t just characters in movies like 1987’s Project X. They’re real. And they’re at Central Washington University. In fact, they’re pretty much only at Central Washington: The school’s Chimpanzee-Human Communication Institute is one of the few programs in the world that teaches sign language to primates. Students can gain practical experience through one of the institute’s summer apprenticeships, in which undergraduates clean cages, prepare meals for the chimps, and observe them at play.
University of Washington
Seattle
That one school could bring us both the Stardust Project (NASA’s successful effort to collect comet dust) and Pepper Schwartz (the sociology professor whose research has resulted in 14 books, several appearances on Oprah’s couch as a relationship expert, and the establishment of dating site Perfectmatch.com) is a testament to how much intellectual freedom the University of Washington gives its professors. In 2007, the Huskies ranked 12th in the nation among all colleges for research, according to the Arizona-based Center for Measuring University Performance, which looks at everything from research funding to the number of doctorates awarded. Thanks to the $1 billion in research funding the university scored in 2007, we’re guessing the Huskies will now rank a little higher in the pack.
CULTURE – Sports Standouts
University of Oregon

Autzen Stadium at University of Oregon
Image: University of Oregon
Eugene
Other Pac-10 schools may have more conference and national titles to their name, but few institutions in the country can claim the kind of financial support for sports that the University of Oregon can. For one thing, as any Oregonian knows, Nike founders Phil Knight and Bill Bowerman forged their partnership here—and, eventually, their patented waffle-sole shoes—when Knight ran track for coach Bowerman in the 1950s. Knight developed a soft spot for his alma mater: He’s donated more than $125 million to the school, including a $100 million gift in 2007 to support its athletic programs. Gifts like these helped bring college baseball back on campus after a 26-year hiatus and have also helped more student athletes afford school: The average athletic scholarship at Oregon is $19,276, the highest of any public university in the Northwest. Oh, and the Ducks also have a $200 million arena in the works. But lest one think a zeal for athletics precludes a passion for academics, consider that athletic director Pat Kilkenny and his wife, Stephanie, donated $1 million to the university’s academic programs this year. The money will be used for, among other things, library improvements, scholarships for low-income students, and the founding of the Competition Not Conflict program, which seeks to use sports as a way to resolve conflicts. Moreover, in his first year, Kilkenny donated his entire $500,000 salary to the school—half went to the athletic department and half went to academics, making both winners.
Linfield College
McMinnville
High school athletes may dream of becoming the next Joey Harrington, but fewer than 5 percent of them will earn college sports scholarships. But students’ love of the game doesn’t have to end with high school graduation—at least, not at a school like Linfield. While the NCAA Division III school, tucked away in bucolic McMinnville, doesn’t offer students scholarships to play, its athletic department remains highly competitive. Not only is 1998 World Series MVP (and Linfield alum) Scott Brosius now the head baseball coach, but in the past 40 years Linfield teams have won seven national championships in football, baseball, and softball. The football team has had more consecutive winning seasons (53) than any other in the country at any level. Some professors even integrate sports into their research: In 2005, health professor and head track coach Garry Killgore invented the AQx, a water exercise shoe that injured athletes can wear in the pool for a low-impact workout. Rumor has it that the PGA’s coolest cat—the one currently nursing a knee injury—has even ordered a pair.
Gonzaga University
Spokane, Washington
“Boards,” “jumper,” and “March Madness” are as much a part of the discourse at this Spokane school as “homework,” “midterm,” and “lecture.” And no wonder: Gonzaga’s is one of only six teams in the United States to have made 10 consecutive appearances at the NCAA Division I men’s basketball championships. The five other schools each have more than 10,000 students, but Gonzaga’s enrollment hit just 4,386 last year—and you bet all of them know where to find the gym, affectionately called “The Kennel” (the school mascot is a bulldog). In fact, more than 3,000 students a year join the Kennel Club, a group of supporters who have appeared in ESPN highlight reels and who believe their brand of school spirit (matching red shirts and chanting from seats that are as close to the court as NCAA rules allow) helped Gonzaga earn the third-longest at-home winning streak in college basketball history.
CULTURE – Activist Minds
Gonzaga University’s PACCAR Center for Applied Science, which will become the university’s first LEED-certified building.
Image: Jennifer Raudebaugh
Gonzaga University
Spokane, Washington
Perhaps because of the school’s affiliation with the Catholic Church (students are required to take three religion courses during their four years), Gonzaga has a reputation for doing good. And no, we’re not talking about becoming missionaries. Last year students donated more than 100,000 hours of community service through programs at the school’s Center for Community Action and Service Learning. Some students spend their spring break building houses in low-income areas of cities across the country; others have prepared and delivered food to poor families in Spokane through the Campus Kitchens project. Giving back is a tradition the Zags continue after graduation: Among US schools its size, Gonzaga ranked second in the number of students who volunteered for the Peace Corps this year.
Lewis & Clark College
At Lewis & Clark’s annual PIO Fair, campus groups recruit new members.
Image: Steve Hambuchen
Portland
Located near Tryon Creek State Park and surrounded as it is by multimillion-dollar homes on Palatine Hill, much of Lewis & Clark’s campus has an isolated feel, which makes it somewhat surprising that the college has one of the most globally aware and politically active student bodies in the country. “Activism is a large part of Lewis & Clark culture,” says senior political science student Myriah Heddens. Indeed, the Princeton Review ranks the student body as the 18th most politically active in the nation, in part because of students like Heddens, who co-chairs the school’s Multicultural Symposium and also directs its Coalition for English Education and Social Advocacy, a tutoring program for the school’s janitorial staff. The administration even sets aside grant money for student-led efforts. Of course, Lewis & Clark activists have some pretty strong role models on Palatine Hill, especially with the country’s leading environmental law school just a few blocks away. Like Elliott Young, a history professor who, as part of his US-Mexico Borderlands course, invited students to spend their spring break on the border, learning about migration patterns between Portland and Oaxaca. Or economics professor Eban Goodstein, who helped initiate Focus the Nation, an event designed to raise awareness about global climate change. Raise awareness it did: Close to a million college students across the country took part in the Teach-In on Global Warming on January 31, 2008. And the 50 faculty members and hundreds of Lewis & Clark students who participated were smack in the middle of it all—right where they like to be.
University of Oregon
Eugene
It’s little wonder that seven Portland mayors and seven Oregon governors have graduated from this institution. The school ranks 20th (just behind Lewis & Clark College) on the Princeton Review’s list of most politically active students. And the most important issue for the public-service-minded students these days? The environment. Last year the student government spent more than $1 million on sustainability-related programs.
CULTURE – Green Minds
Portland State University

PSU’s new president, Wim Wiewel
Image: Portland State University
Portland
It’s only fitting that the flagship university of one of the greenest cities in America also has a reputation as one of the country’s greenest schools, especially considering that its motto is “Let knowledge serve the city.” The image is something that Portland State University (PSU) has worked hard to establish: Sixty-three percent of students and staff bike, walk, or take public transportation to campus; five campus buildings already meet LEED Silver standards, and two more are being renovated to do so; an ecoroof atop one of the school’s buildings was the first large-scale ecoroof in Portland; and the school has pledged to use 100 percent renewable energy by 2010. Such efforts have not gone unnoticed. This fall the Miller Foundation, which supports Oregon arts and education, gave the school what was, by all accounts, the largest donation to a university for sustainability research and education—$25 million. “It was heartening to be given this kind of a seal of approval,” says PSU president Wim Wiewel. “This money will allow us to hire some additional faculty, to support more graduate and undergraduate students, and to attract the best students in the sustainability field.” It also will give the school the chance to carry out some pet projects, like a green building laboratory where faculty and students can test the latest in green building materials, technologies, and processes. Says Wiewel, “We want to help people in the Portland region lead more sustainable lives.” Now that’s knowledge serving the city.
University of Washington
Seattle
Its official school colors may be purple and gold, but on the inside, this 26,622-student university
is green to the core. The Seattle campus is one of only 15 in the country to earn an A- (the highest mark given) from the Sustainable Endowments Institute, thanks in large part to the administration’s commitment to sustainability: Nearly 100 percent of the school’s electricity is purchased from renewable sources; 26 percent of the dining-services budget goes to local and organic food; and all new buildings will be constructed to meet LEED Silver standards. So why the minus? Because when it comes to the environment, there’s always room for improvement.
Western Washington University
Belllingham, Washington
Home to one of America’s oldest environmental schools, Huxley College, Western Washington has been churning out generations of eco-conscious graduates since 1971. But apparently the entire student body here cares about its impact on the earth: Just last year, students voted to impose a quarterly fee on themselves to pay for year-round bus passes for everyone. The bus will just have to do until the school is able to supply students with a carpool fleet of Viking 45s—hybrid cars being designed by the university’s Vehicle Research Institute. They can cover 100 miles on a single gallon of gas.
POST COLLEGE – Grad School Shoo-ins
Reed College
Portland
The library is the most popular place on Reed’s campus, and that devotion to study has a big payoff: Reedies are accepted to medical school at a rate of 85 percent, 31 Rhodes scholars have come from Reed, and only three other schools in the country (California Institute of Technology, Harvey Mudd College, and Massachusetts Institute of Technology) produce a higher percentage of PhDs in science and engineering fields. Why is this small Southeast Portland school so exceptional at preparing students for graduate work? Because going to Reed is like going to graduate school. At the end of their junior year, Reedies must pass a qualifying exam before beginning their senior theses. And that senior thesis isn’t the 20-page research paper you might find at other liberal arts colleges. It’s a yearlong project built on original research, and it must be defended in an oral exam before a panel of professors (and sometimes outside experts). After that kind of trial by fire, spending three hours on the GRE is no big thing.
Whitman College
Walla Walla, Washington
A whopping 60 percent of Whitman graduates hold advanced degrees. That’s due, in part, to the 3-2 programs the school offers. A 3-2 program lets students earn dual undergraduate degrees from two different schools and gives them an edge when applying to the larger university’s master’s program. For example, in the 3-2 engineering and computer science program, students earn a BA from Whitman in natural and mathematical sciences and a BS from Duke University in engineering or computer science. They then can go on to join Duke’s graduate engineering school. Whitman has three of these programs, rare for such a small school: engineering and computer science (with California Institute of Technology, Columbia University, Duke University, the University of Washington, and Washington University in St. Louis), forestry and environmental management (with Duke), and oceanography and biology (with the University of Washington).
POST COLLEGE – Debt-Free(ish) Degrees
Reed College
Portland
With a yearly tuition of $34,530, Reed is one of the most expensive schools in the Northwest, but this bastion of liberal learning also offers some of the best financial aid packages. To wit: The average financial aid package is $32,154, and $28,108 comes from scholarships and grants, not loans (about 50 percent of full-time students qualify for financial aid, on par with most schools). That means Reed students, in spite of tuition costs, typically graduate with debts of only about $17,000. Some people pay more for their first car.
University of Oregon
Eugene
At $6,036 per year (in-state tuition), the University of Oregon still has one of the lowest sticker prices in the Northwest. And for the 47 percent of in-state students who receive financial assistance, there’s even better news: In-state undergraduates receive an average of $5,186 in need-based gift aid. For the un-initiated, that means free money.
Crib Sheet
Our 40 Northwest Colleges & Universities by the Numbers
It doesn’t take a genius to know it can be difficult to figure out which college to attend. A school that’s a perfect fit for the student who prefers the formality of a lecture hall might not be right for the one who learns best by getting out in the field. When faced with a foot-high pile of glossy college brochures all designed to woo, sometimes a cheat sheet that compares key numbers at a glance can help. Will your high school grades pass muster with the admissions team? Will you be able to graduate in four years? And, importantly, will you be able to graduate sans debt?
Nothing can replace a campus tour or meetings with students and professors when deciding where to spend what might be the best years of your life, but our list of 40 Oregon and Washington colleges and universities may help you decide which schools you might want to visit. (To pare down the list, we’ve excluded community colleges, vocational schools, institutions that issued fewer than 100 bachelor’s degrees in 2004, and schools that weren’t independently accredited by the Northwest Commission on Colleges and Universities.)
To create our list, we polled the schools for information in 16 diferent categories, including things like average SAT scores and GPAs of entering freshmen, percentage of work-study funds that go to community service opportunities for students (allowing undergraduates to earn financial aid by doing things like tutoring instead of serving food at the cafeteria), and alumni giving rates (which can indicate students’ satisfaction with their alma mater). Read our full methodology here . Think of the list as a kind of CliffsNotes for Northwest colleges—like them, this chart should be considered a supplement. You still have to read the book, which in this case means taking the campus tour.
Now, go do your homework.
Central Washington University*
Location, Year Founded: Ellensburg, WA, 1891
Undergraduate Enrollment: 9,979
Yearly Tuition: In-State/Out-of-state: $4,841/$14,713
Avg. Financial Aid Package: $8,438
Acceptance Rate : 80, Freshman Retention Rate %: 79
Midrange SAT Scores for Critical Reading; SAT Scores for Math: 430-550, 440-550
Avg GPA of Incoming Freshman: 3.2
African American Students: 3, % Asian Students: 7, % Hispanic Students: 7
Avg Number of Years to Obtain Bachelor’s Degree, Alumni Giving Rate: 4.7, 6%
Number of Master’s Programs Offered, Number of Doctoral Programs Offered: 66, 0
Percent of Work-Study Funds Spent on Community Service: 16%
Concordia University
Location, Year Founded: Portland, 1905
Undergraduate Enrollment: 1,065
Yearly Tuition:$21,000
Avg. Financial Aid Package: $10,000
Acceptance Rate : 60, Freshman Retention Rate %: 67
Midrange SAT Scores for Critical Reading; SAT Scores for Math: 519, 515
Avg GPA of Incoming Freshman: 3.3
African American Students: 6*, % Asian Students: 4*, % Hispanic Students: 4*
Avg Number of Years to Obtain Bachelor’s Degree, Alumni Giving Rate: 4%, 15%
*Number of Master’s Programs Offered, Number of Doctoral Programs Offered: 3, 0
Percent of Work-Study Funds Spent on Community Service: 20
Corban College*
Location, Year Founded: Salem, 1935
Undergraduate Enrollment: 901
Yearly Tuition: $19,084
Avg. Financial Aid Package: $14,326
Acceptance Rate : 81, Freshman Retention Rate %: 72
Midrange SAT Scores for Critical Reading; SAT Scores for Math: 495-610, 460-590
Avg GPA of Incoming Freshman: 3.5
African American Students: 5, % Asian Students: 3, % Hispanic Students: 1
Avg Number of Years to Obtain Bachelor’s Degree, Alumni Giving Rate: 4.2, 8%
Number of Master’s Programs Offered, Number of Doctoral Programs Offered: 2, 0
Percent of Work-Study Funds Spent on Community Service:7%
Cornish College of the Arts
Location, Year Founded: Seattle, WA, 1914
Undergraduate Enrollment: 815
Yearly Tuition: $23,700
Avg. Financial Aid Package: $6,500
Acceptance Rate : N/A, Freshman Retention Rate %: 69
Midrange SAT Scores for Critical Reading; SAT Scores for Math: N/A
Avg GPA of Incoming Freshman: N/A
African American Students: 4, % Asian Students: 4, % Hispanic Students: 4
Avg Number of Years to Obtain Bachelor’s Degree, Alumni Giving Rate: 4, 14%
Number of Master’s Programs Offered, Number of Doctoral Programs Offered: 0,0
Percent of Work-Study Funds Spent on Community Service: 17%
Eastern Oregon University
Location, Year Founded: La Grande, 1929
Undergraduate Enrollment: 3,032
Yearly Tuition: $6,241
Avg. Financial Aid Package: $12, 665*
Acceptance Rate : 78, Freshman Retention Rate %: 66
Midrange SAT Scores for Critical Reading; SAT Scores for Math: 418-530, 410-530
Avg GPA of Incoming Freshman: 3.2
African American Students: 1, % Asian Students: 2, % Hispanic Students: 4
Avg Number of Years to Obtain Bachelor’s Degree, Alumni Giving Rate: 4.7, 9%
Number of Master’s Programs Offered, Number of Doctoral Programs Offered: 3, 0
Percent of Work-Study Funds Spent on Community Service: 30%
Eastern Washington University
Location, Year Founded: Cheney, WA, 1882
Undergraduate Enrollment: 8,637
Yearly Tuition: In-State/Out-of-state: $4,485/$13,749
Avg. Financial Aid Package: $16,500
Acceptance Rate : 80, Freshman Retention Rate %: 76
Midrange SAT Scores for Critical Reading; SAT Scores for Math: 410-539**, 420-540**
Avg GPA of Incoming Freshman: 3.3
African American Students: 3, % Asian Students: 4, % Hispanic Students: 8
Avg Number of Years to Obtain Bachelor’s Degree, Alumni Giving Rate: 4.8, 17%
Number of Master’s Programs Offered, Number of Doctoral Programs Offered: 50, 1
Percent of Work-Study Funds Spent on Community Service: 7%
George Fox University
Location, Year Founded: Newberg, 1891
Undergraduate Enrollment: 1,946
Yearly Tuition: $23,470
Avg. Financial Aid Package: $21,552
Acceptance Rate : 83, Freshman Retention Rate %: 80
Midrange SAT Scores for Critical Reading; SAT Scores for Math: 480-600, 470-590
Avg GPA of Incoming Freshman: 3.5
African American Students: 2, % Asian Students: 4, % Hispanic Students: 6
Avg Number of Years to Obtain Bachelor’s Degree, Alumni Giving Rate: 4.1, 10%
Number of Master’s Programs Offered, Number of Doctoral Programs Offered: 11, 5
Percent of Work-Study Funds Spent on Community Service: 15%
Gonzaga University
Location, Year Founded: Spokane, WA, 1887
Undergraduate Enrollment: 4,386*
Yearly Tuition: $27,820
Avg. Financial Aid Package: $20,127
Acceptance Rate : 68, Freshman Retention Rate %: 92
Midrange SAT Scores for Critical Reading; SAT Scores for Math: 540-630, 550-650
Avg GPA of Incoming Freshman: 3.7
African American Students: 1, % Asian Students: 5, % Hispanic Students: 4
Avg Number of Years to Obtain Bachelor’s Degree, Alumni Giving Rate: 4.3, 27%
Number of Master’s Programs Offered, Number of Doctoral Programs Offered:25, 2
Percent of Work-Study Funds Spent on Community Service: 19
Lewis & Clark College
Location, Year Founded: Portland, 1867
Undergraduate Enrollment: 1,964
Yearly Tuition: $33,490
Avg. Financial Aid Package: $23,801
Acceptance Rate : 58, Freshman Retention Rate %: 86
Midrange SAT Scores for Critical Reading; SAT Scores for Math: 610-700, 590-680
Avg GPA of Incoming Freshman: 3.7
African American Students: 2, % Asian Students: 6, % Hispanic Students: 4
Avg Number of Years to Obtain Bachelor’s Degree, Alumni Giving Rate: 4.1, 25%
Number of Master’s Programs Offered, Number of Doctoral Programs Offered: 15, 1
Percent of Work-Study Funds Spent on Community Service: 25%
Linfield College
Location, Year Founded: McMinnville, 1858
Undergraduate Enrollment: 2,519
Yearly Tuition: $27,150
Avg. Financial Aid Package: $16,275*
Acceptance Rate : 79, Freshman Retention Rate %: 83
Midrange SAT Scores for Critical Reading; SAT Scores for Math: 490-610, 500-610
Avg GPA of Incoming Freshman: 3.6
African American Students: 2, % Asian Students: 8, % Hispanic Students: 5
Avg Number of Years to Obtain Bachelor’s Degree, Alumni Giving Rate: 4.2, 18%
Number of Master’s Programs Offered, Number of Doctoral Programs Offered: 0,0
Percent of Work-Study Funds Spent on Community Service: 7%
Marylhurst University
Location, Year Founded: Marylhurst, 1893
Undergraduate Enrollment: 946
Yearly Tuition: $15,705
Avg. Financial Aid Package: $12,122
Acceptance Rate : 98, Freshman Retention Rate %: NA
Midrange SAT Scores for Critical Reading; SAT Scores for Math: NA, NA
Avg GPA of Incoming Freshman: NA
African American Students: 5, % Asian Students: 5, % Hispanic Students: 5
Avg Number of Years to Obtain Bachelor’s Degree, Alumni Giving Rate: NA, 15%
Number of Master’s Programs Offered, Number of Doctoral Programs Offered: 7, 0
Percent of Work-Study Funds Spent on Community Service: 10%
Multnomah University
Location, Year Founded: Portland, 1936
Undergraduate Enrollment: 567
Yearly Tuition: In-State/Out-of-state: $14,100
Avg. Financial Aid Package: $3,258
Acceptance Rate : 79, Freshman Retention Rate %: N/A
Midrange SAT Scores for Critical Reading; SAT Scores for Math: 520, 536
Avg GPA of Incoming Freshman: 3.5
African American Students: 2, % Asian Students: 3, % Hispanic Students: 2
Avg Number of Years to Obtain Bachelor’s Degree, Alumni Giving Rate: 5, 39%
Number of Master’s Programs Offered, Number of Doctoral Programs Offered: 5, 1
Percent of Work-Study Funds Spent on Community Service: 7%
Northwest Christian University
Location, Year Founded: Eugene, 1895
Undergraduate Enrollment: 437
Yearly Tuition: $21,900
Avg. Financial Aid Package: $18,233**
Acceptance Rate : 54, Freshman Retention Rate %: 63
Midrange SAT Scores for Critical Reading; SAT Scores for Math: 470-560. 470-570
Avg GPA of Incoming Freshman: 3.4
African American Students: 3, % Asian Students: 2, % Hispanic Students: 4
Avg Number of Years to Obtain Bachelor’s Degree, Alumni Giving Rate: N/A, N/A
Number of Master’s Programs Offered, Number of Doctoral Programs Offered: 4, 0
Percent of Work-Study Funds Spent on Community Service: 21%
Northwest University
Location, Year Founded: Kirkland, WA, 1934
Undergraduate Enrollment: 1,114
Yearly Tuition: $20,520
Avg. Financial Aid Package: $14,353
Acceptance Rate : 75, Freshman Retention Rate %: 71
Midrange SAT Scores for Critical Reading; SAT Scores for Math:460 – 600**, 440 – 560**
Avg GPA of Incoming Freshman: 3.4
African American Students: 3, % Asian Students: 8, % Hispanic Students: 5
Avg Number of Years to Obtain Bachelor’s Degree, Alumni Giving Rate: 4, 18%
Number of Master’s Programs Offered, Number of Doctoral Programs Offered: 7, 0
Percent of Work-Study Funds Spent on Community Service: 7%
Oregon Institute of Technology
Location, Year Founded: Klamath Falls, 1947
Undergraduate Enrollment: 3,290
Yearly Tuition: In-State/Out-of-state: $5,781/$15,558
Avg. Financial Aid Package: $5,211
Acceptance Rate : 94, Freshman Retention Rate %: 69
Midrange SAT Scores for Critical Reading; SAT Scores for Math: 430-560, 460-580
Avg GPA of Incoming Freshman: 3.4
African American Students: 1, % Asian Students: 5, % Hispanic Students: 5
Avg Number of Years to Obtain Bachelor’s Degree, Alumni Giving Rate: 4.6, 4%
Number of Master’s Programs Offered, Number of Doctoral Programs Offered: 1, 0
Percent of Work-Study Funds Spent on Community Service: 4%
Oregon State University
Location, Year Founded: Corvallis, 1858
Undergraduate Enrollment: 16,228
Yearly Tuition: In-State/Out-of-state: $6,187/$18,823
Avg. Financial Aid Package: $9,022
Acceptance Rate : 84, Freshman Retention Rate %: 81
Midrange SAT Scores for Critical Reading; SAT Scores for Math: 460-580, 490-610
Avg GPA of Incoming Freshman: 3.5
African American Students: 2, % Asian Students: 8, % Hispanic Students: 4
Avg Number of Years to Obtain Bachelor’s Degree, Alumni Giving Rate: 4.4, 15%*
*Number of Master’s Programs Offered, Number of Doctoral Programs Offered: 154, 62
Percent of Work-Study Funds Spent on Community Service: 7%
Pacific Lutheran University
Location, Year Founded: Tacoma, WA, 1880
Undergraduate Enrollment: 3,300
Yearly Tuition: $26,800
Avg. Financial Aid Package: $22,820
Acceptance Rate : 75, Freshman Retention Rate %: 83
Midrange SAT Scores for Critical Reading; SAT Scores for Math: 500-620**, 490-610**
Avg GPA of Incoming Freshman: 3.6
African American Students: 2, % Asian Students: 6, % Hispanic Students: 3
Avg Number of Years to Obtain Bachelor’s Degree, Alumni Giving Rate: 4, 13%
Number of Master’s Programs Offered, Number of Doctoral Programs Offered: 5, 0
Percent of Work-Study Funds Spent on Community Service: 7%
Pacific University*
Location, Year Founded: Forest Grove, 1880
Undergraduate Enrollment: 1,452
Yearly Tuition: $25,830
Avg. Financial Aid Package: $22,706
Acceptance Rate : 83, Freshman Retention Rate %: 81
Midrange SAT Scores for Critical Reading; SAT Scores for Math: 510-600, 490-610
Avg GPA of Incoming Freshman: 3.6
African American Students: 1, % Asian Students: 24, % Hispanic Students: 4
Avg Number of Years to Obtain Bachelor’s Degree, Alumni Giving Rate: 4.1, 11%
Number of Master’s Programs Offered, Number of Doctoral Programs Offered: 7, 4
Percent of Work-Study Funds Spent on Community Service: 12%
Portland State University
Location, Year Founded: Portland, 1946
Undergraduate Enrollment: 18,916
Yearly Tuition: In-State/Out-of-state: $5,765**/$17,831**
Avg. Financial Aid Package: $8,149
Acceptance Rate : 68, Freshman Retention Rate %: 67
Midrange SAT Scores for Critical Reading; SAT Scores for Math: 460-600**, 460-580**
Avg GPA of Incoming Freshman: 3.3
African American Students: 3, % Asian Students: 8, % Hispanic Students: 5
Avg Number of Years to Obtain Bachelor’s Degree, Alumni Giving Rate: 5.7, 5%
Number of Master’s Programs Offered, Number of Doctoral Programs Offered: 53, 14
Percent of Work-Study Funds Spent on Community Service: 11%
Reed College
Location, Year Founded: Portland, 1908
Undergraduate Enrollment: 1,442
Yearly Tuition: $34,530
Avg. Financial Aid Package: $32,154**
Acceptance Rate : 32, Freshman Retention Rate %: 88
Midrange SAT Scores for Critical Reading; SAT Scores for Math: 660-760, 630-710
Avg GPA of Incoming Freshman: 3.9
African American Students: 3, % Asian Students: 9, % Hispanic Students: 7
Avg Number of Years to Obtain Bachelor’s Degree, Alumni Giving Rate: 4.2, 28% *
*Number of Master’s Programs Offered, Number of Doctoral Programs Offered: 1, 0
Percent of Work-Study Funds Spent on Community Service: 11%
Saint Martin’s University
Location, Year Founded: Lacey, WA, 1885
Undergraduate Enrollment: 1,344
Yearly Tuition: In-State/Out-of-state: $23,810
Avg. Financial Aid Package: $23,000
Acceptance Rate : 82, Freshman Retention Rate %: 76
Midrange SAT Scores for Critical Reading; SAT Scores for Math: 420-560, 420-540**
Avg GPA of Incoming Freshman: 3.2
African American Students: 6, % Asian Students: 7, % Hispanic Students: 6
Avg Number of Years to Obtain Bachelor’s Degree, Alumni Giving Rate: 4, 10%
Number of Master’s Programs Offered, Number of Doctoral Programs Offered: 6, 0
Percent of Work-Study Funds Spent on Community Service: 11%
Seattle Pacific University
Location, Year Founded: Seattle, WA, 1891
Undergraduate Enrollment: 3,007
Yearly Tuition: $26,457
Avg. Financial Aid Package: $23,122*
Acceptance Rate : 88, Freshman Retention Rate %: 86
Midrange SAT Scores for Critical Reading; SAT Scores for Math: 530-620, 540-620
Avg GPA of Incoming Freshman: 3.6
African American Students: 2, % Asian Students: 7, % Hispanic Students: 3
Avg Number of Years to Obtain Bachelor’s Degree, Alumni Giving Rate: 4.1, 12%
Number of Master’s Programs Offered, Number of Doctoral Programs Offered: 12, 3
Percent of Work-Study Funds Spent on Community Service: 19%
Seattle University
Location, Year Founded: Seattle, WA, 1891
Undergraduate Enrollment: 4,326
Yearly Tuition: $28,260
Avg. Financial Aid Package: $21,771
Acceptance Rate : 64, Freshman Retention Rate %: 85
Midrange SAT Scores for Critical Reading; SAT Scores for Math: 520-640, 530-630
Avg GPA of Incoming Freshman: 3.6
African American Students: 5, % Asian Students: 20, % Hispanic Students: 7
Avg Number of Years to Obtain Bachelor’s Degree, Alumni Giving Rate: 4, 14%
Number of Master’s Programs Offered, Number of Doctoral Programs Offered: 30, 1
Percent of Work-Study Funds Spent on Community Service: N/A
Southern Oregon University
Location, Year Founded: Ashland, 1926
Undergraduate Enrollment: 4,461
Yearly Tuition: In-State/Out-of-state: $5,677/$18,669
Avg. Financial Aid Package: $7,297
Acceptance Rate : 80, Freshman Retention Rate %: 65
Midrange SAT Scores for Critical Reading; SAT Scores for Math: 1040 (reading and math combined)
Avg GPA of Incoming Freshman: 3.3
African American Students: 2, % Asian Students: 4, % Hispanic Students: 5
Avg Number of Years to Obtain Bachelor’s Degree, Alumni Giving Rate: 4.7, 6%
Number of Master’s Programs Offered, Number of Doctoral Programs Offered: 11, 0
Percent of Work-Study Funds Spent on Community Service: 5%
The Evergreen State College
Location, Year Founded: Olympia, WA, 1967
Undergraduate Enrollment: 4,586
Yearly Tuition: In-State/Out-of-state: $5,342/$15,462
Avg. Financial Aid Package: $11,398**
Acceptance Rate : 97, Freshman Retention Rate %: 69
Midrange SAT Scores for Critical Reading; SAT Scores for Math: 520-640**, 460-590**
Avg GPA of Incoming Freshman: 3.1
African American Students: 4, % Asian Students: 5, % Hispanic Students: 5
Avg Number of Years to Obtain Bachelor’s Degree, Alumni Giving Rate: 4, 8%
Number of Master’s Programs Offered, Number of Doctoral Programs Offered: 4, 0
Percent of Work-Study Funds Spent on Community Service: 30%
University of Oregon*
Location, Year Founded: Eugene, 1876
Undergraduate Enrollment: 16,681
Yearly Tuition: In-State/Out-of-state: $6,036/$18,792
Avg. Financial Aid Package: $8,682
Acceptance Rate : 45, Freshman Retention Rate %: 85
Midrange SAT Scores for Critical Reading; SAT Scores for Math: 486 – 606**, 496 – 611**
Avg GPA of Incoming Freshman: 3.5
African American Students: 2, % Asian Students: 6, % Hispanic Students: 4
Avg Number of Years to Obtain Bachelor’s Degree, Alumni Giving Rate: 4.6, 17%
Number of Master’s Programs Offered, Number of Doctoral Programs Offered: 80, 50
Percent of Work-Study Funds Spent on Community Service:7%
University of Portland
Location, Year Founded: Portland, 1901
Undergraduate Enrollment: 2,997
Yearly Tuition: $29,400
Avg. Financial Aid Package: $24,516*
Acceptance Rate : 59*, Freshman Retention Rate %: 86*
Midrange SAT Scores for Critical Reading; SAT Scores for Math: 530-640*, 540-640*
Avg GPA of Incoming Freshman: 3.7*
African American Students: 1, % Asian Students: 10, % Hispanic Students: 5
Avg Number of Years to Obtain Bachelor’s Degree, Alumni Giving Rate: 4*, 16% *
Number of Master’s Programs Offered, Number of Doctoral Programs Offered: 11, 1
Percent of Work-Study Funds Spent on Community Service: 7%
University of Puget Sound
Location, Year Founded: Tacoma, WA, 1888
Undergraduate Enrollment: 2,566
Yearly Tuition: $33,780
Avg. Financial Aid Package: $25,664
Acceptance Rate : 65, Freshman Retention Rate %: 86
Midrange SAT Scores for Critical Reading; SAT Scores for Math: 570-675, 570-665
Avg GPA of Incoming Freshman: 3.5
African American Students: 3, % Asian Students: 9, % Hispanic Students: 4
Avg Number of Years to Obtain Bachelor’s Degree, Alumni Giving Rate: 4.1, 19% *
Number of Master’s Programs Offered, Number of Doctoral Programs Offered: 3, 1
Percent of Work-Study Funds Spent on Community Service: 8%
University of Washington—Bothell
Location, Year Founded: Bothell, WA, 1990
Undergraduate Enrollment: 1,649
Yearly Tuition: In-State/Out-of-state: $6,673/$23,090
Avg. Financial Aid Package: $11,350
Acceptance Rate : 76, Freshman Retention Rate %: N/A
Midrange SAT Scores for Critical Reading; SAT Scores for Math: 460-560^, 490-590^
Avg GPA of Incoming Freshman: 3.3
African American Students: 3, % Asian Students: 20, % Hispanic Students: 5
Avg Number of Years to Obtain Bachelor’s Degree, Alumni Giving Rate: N/A, 14%
Number of Master’s Programs Offered, Number of Doctoral Programs Offered: 5, 0
Percent of Work-Study Funds Spent on Community Service: 14%
University of Washington—Seattle*
Location, Year Founded: Seattle, WA, 1861
Undergraduate Enrollment: 26,622
Yearly Tuition: In-State/Out-of-state: $6,385/$22,131
Avg. Financial Aid Package: $11,200
Acceptance Rate : 61, Freshman Retention Rate %: 93
Midrange SAT Scores for Critical Reading; SAT Scores for Math: 530-650, 560-670
Avg GPA of Incoming Freshman: 3.7
African American Students: 3, % Asian Students: 21, % Hispanic Students: 5
Avg Number of Years to Obtain Bachelor’s Degree, Alumni Giving Rate: 4.4, 18%
Number of Master’s Programs Offered, Number of Doctoral Programs Offered: 414, 245
Percent of Work-Study Funds Spent on Community Service: 14%
University of Washington—Tacoma
Location, Year Founded: Tacoma, WA, 1990
Undergraduate Enrollment: 2,444
Yearly Tuition: In-State/Out-of-state: $6,730/$23,147
Avg. Financial Aid Package: $11,200
Acceptance Rate : 79, Freshman Retention Rate %: N/A
Midrange SAT Scores for Critical Reading; SAT Scores for Math: 420-540, 420-550
Avg GPA of Incoming Freshman: 3.3
African American Students: 7, % Asian Students: 15, % Hispanic Students: 7
Avg Number of Years to Obtain Bachelor’s Degree, Alumni Giving Rate: N/A, 13%
Number of Master’s Programs Offered, Number of Doctoral Programs Offered: 6, 0
Percent of Work-Study Funds Spent on Community Service: 14%
Walla Walla University
Location, Year Founded: College Place, WA, 1882
Undergraduate Enrollment: 1,563
Yearly Tuition: $20,910
Avg. Financial Aid Package: $19,046
Acceptance Rate : 98, Freshman Retention Rate %: 73
Midrange SAT Scores for Critical Reading; SAT Scores for Math: 533, 522
Avg GPA of Incoming Freshman: 3.4
African American Students: 3, % Asian Students: 6, % Hispanic Students: 10
Avg Number of Years to Obtain Bachelor’s Degree, Alumni Giving Rate: 5.1, 13%
Number of Master’s Programs Offered, Number of Doctoral Programs Offered: 6, 0
Percent of Work-Study Funds Spent on Community Service: 15%
Warner Pacific College
Location, Year Founded: Portland, 1937
Undergraduate Enrollment: 651
Yearly Tuition: $16,000
Avg. Financial Aid Package: $10,720
Acceptance Rate : 60, Freshman Retention Rate %: 70
Midrange SAT Scores for Critical Reading; SAT Scores for Math: 440-540, 428-543
Avg GPA of Incoming Freshman: 3.3
African American Students: 5, % Asian Students: 1, % Hispanic Students: 5
Avg Number of Years to Obtain Bachelor’s Degree, Alumni Giving Rate: 4, 9%
Number of Master’s Programs Offered, Number of Doctoral Programs Offered: 4, 0
Percent of Work-Study Funds Spent on Community Service: 8%
Washington State University
Location, Year Founded: Pullman, WA, 1890
Undergraduate Enrollment: 15,147
Yearly Tuition: In-State/Out-of-state: $6,720/$17,756
Avg. Financial Aid Package: $10,366
Acceptance Rate : 76**, Freshman Retention Rate %: 84
Midrange SAT Scores for Critical Reading; SAT Scores for Math: 490-600, 510-610
Avg GPA of Incoming Freshman: 3.5
African American Students: 2, % Asian Students: 6, % Hispanic Students: 5
Avg Number of Years to Obtain Bachelor’s Degree, Alumni Giving Rate: 4.5, 17%
Number of Master’s Programs Offered, Number of Doctoral Programs Offered: 73, 46
Percent of Work-Study Funds Spent on Community Service: 13%
Washington State University—Tri-Cities
Location, Year Founded: Richland, WA, 1989
Undergraduate Enrollment: 824
Yearly Tuition: In-State/Out-of-state: $6,720/$17,756
Avg. Financial Aid Package: $10,366
Acceptance Rate : 77, Freshman Retention Rate %: N/A
Midrange SAT Scores for Critical Reading; SAT Scores for Math: N/A, N/A
Avg GPA of Incoming Freshman: 3.3
African American Students: 1, % Asian Students: 2, % Hispanic Students: 11
Avg Number of Years to Obtain Bachelor’s Degree, Alumni Giving Rate: N/A, 17%
Number of Master’s Programs Offered, Number of Doctoral Programs Offered: 12, 6
Percent of Work-Study Funds Spent on Community Service: 13%
Washington State University—Vancouver
Location, Year Founded: Vancouver, WA, 1989
Undergraduate Enrollment: 2,263
Yearly Tuition: In-State/Out-of-state: $6,720/$17,756
Avg. Financial Aid Package: $10,366
Acceptance Rate : 85, Freshman Retention Rate %: N/A
Midrange SAT Scores for Critical Reading; SAT Scores for Math: 480-600, 490-600
Avg GPA of Incoming Freshman: 3.4
African American Students: 1, % Asian Students: 6, % Hispanic Students: 5
Avg Number of Years to Obtain Bachelor’s Degree, Alumni Giving Rate: N/A, 17%
Number of Master’s Programs Offered, Number of Doctoral Programs Offered: 9, 1
Percent of Work-Study Funds Spent on Community Service: 7%
Western Oregon University
Location, Year Founded: Monmouth, 1856
Undergraduate Enrollment: 4,704
Yearly Tuition: In-State/Out-of-state: $5,979/$16,589
Avg. Financial Aid Package: $6,600
Acceptance Rate : 75, Freshman Retention Rate %: 65
Midrange SAT Scores for Critical Reading; SAT Scores for Math: 420-530**, 430-530**
Avg GPA of Incoming Freshman: 3.3
African American Students: 3, % Asian Students: 3, % Hispanic Students: 13
Avg Number of Years to Obtain Bachelor’s Degree, Alumni Giving Rate: 4.5, 24% *
*Number of Master’s Programs Offered, Number of Doctoral Programs Offered: 9, 0
Percent of Work-Study Funds Spent on Community Service: 10%
Western Washington University
Location, Year Founded: Bellingham, WA, 1893
Undergraduate Enrollment: 13,155
Yearly Tuition: In-State/Out-of-state: $5,531/$17,166
Avg. Financial Aid Package: $9,709**
Acceptance Rate : 71, Freshman Retention Rate %: 84
Midrange SAT Scores for Critical Reading; SAT Scores for Math: 490-610**, 500-610**
Avg GPA of Incoming Freshman: 3.5
African American Students: 3, % Asian Students: 9, % Hispanic Students: 4
Avg Number of Years to Obtain Bachelor’s Degree, Alumni Giving Rate: 4.6, 9%
Number of Master’s Programs Offered, Number of Doctoral Programs Offered: 6, 0
Percent of Work-Study Funds Spent on Community Service: 19%
Whitman College
Location, Year Founded: Walla Walla, WA, 1882
Undergraduate Enrollment: 1,452
Yearly Tuition: $34,880
Avg. Financial Aid Package: $32,100
Acceptance Rate : 45, Freshman Retention Rate %: 94
Midrange SAT Scores for Critical Reading; SAT Scores for Math: 630-730, 610-710
Avg GPA of Incoming Freshman: 3.8
African American Students: 2, % Asian Students: 10, % Hispanic Students: 6
Avg Number of Years to Obtain Bachelor’s Degree, Alumni Giving Rate: 4, 47%
Number of Master’s Programs Offered, Number of Doctoral Programs Offered: 0, 0
Percent of Work-Study Funds Spent on Community Service: 25%
Whitworth University
Location, Year Founded: Spokane WA, 1890
Undergraduate Enrollment: 2,394
Yearly Tuition: $27,100
Avg. Financial Aid Package: $22,126
Acceptance Rate : 51, Freshman Retention Rate %: 87
Midrange SAT Scores for Critical Reading; SAT Scores for Math: 550-650**, 560-656**
Avg GPA of Incoming Freshman: 3.7
African American Students: 2, % Asian Students: 4, % Hispanic Students: 3
Avg Number of Years to Obtain Bachelor’s Degree, Alumni Giving Rate: 4.2, 23%
Number of Master’s Programs Offered, Number of Doctoral Programs Offered: 6, 0
Percent of Work-Study Funds Spent on Community Service: 11%
Willamette University
Location, Year Founded: Salem, 1842
Undergraduate Enrollment: 1,900
Yearly Tuition: $33,750
Avg. Financial Aid Package: $27,209
Acceptance Rate : 66, Freshman Retention Rate %: 89
Midrange SAT Scores for Critical Reading; SAT Scores for Math: 570-660, 550-660
Avg GPA of Incoming Freshman: 3.8
African American Students: 2, % Asian Students: 7, % Hispanic Students: 3
Avg Number of Years to Obtain Bachelor’s Degree, Alumni Giving Rate: 4, 19%
Number of Master’s Programs Offered, Number of Doctoral Programs Offered: 2, 3
Percent of Work-Study Funds Spent on Community Service: 23%
Methodology
TO CREATE OUR list of colleges, we began with a list of nonprofit institutions in Oregon and Washington that had been independently accredited by the Northwest Commission on Colleges and Universities. To pare down the list, we excluded community colleges and city colleges, trade schools, schools that issued fewer than 100 bachelor’s degrees in 2004, and those colleges that were not four-year institutions.
We then polled each school for information in 16 different categories, including average SAT scores and GPAs of incoming freshmen, tuition rates, the average financial aid package each provides, the percentage of federal work-study funds that go to community service opportunities for students (allowing undergraduates to earn financial aid by doing things like tutoring instead of serving food in the cafeteria), and alumni giving rates (which can indicate students’ satisfaction with their alma mater).
Most numbers were reported by the schools, but in cases where the school was unable to provide information, we consulted US News & World Report’s America’s Best Colleges 2009 (colleges.usnews.rankingsandreviews.com/college) or the National Center for Education Statistics (nces.ed.gov/collegenavigator). These exceptions are noted in the chart.
While most schools reported data based on fall 2008 enrollment figures, in some cases only information from the 2007-08 academic year was available. This too was noted in the chart. Supplementary information obtained from US News & World Report primarily reflects fall 2007 enrollment figures; NCES figures include data from the 2006-07 and 2007-08 academic years.
Long Story Short
At 80, Photographer Sergio Ortiz Is Still Seeking Wonder

Education
Portland Private Schools, by the Numbers


Long Story Short