Portland Neighborhoods by the Numbers 2016: The City
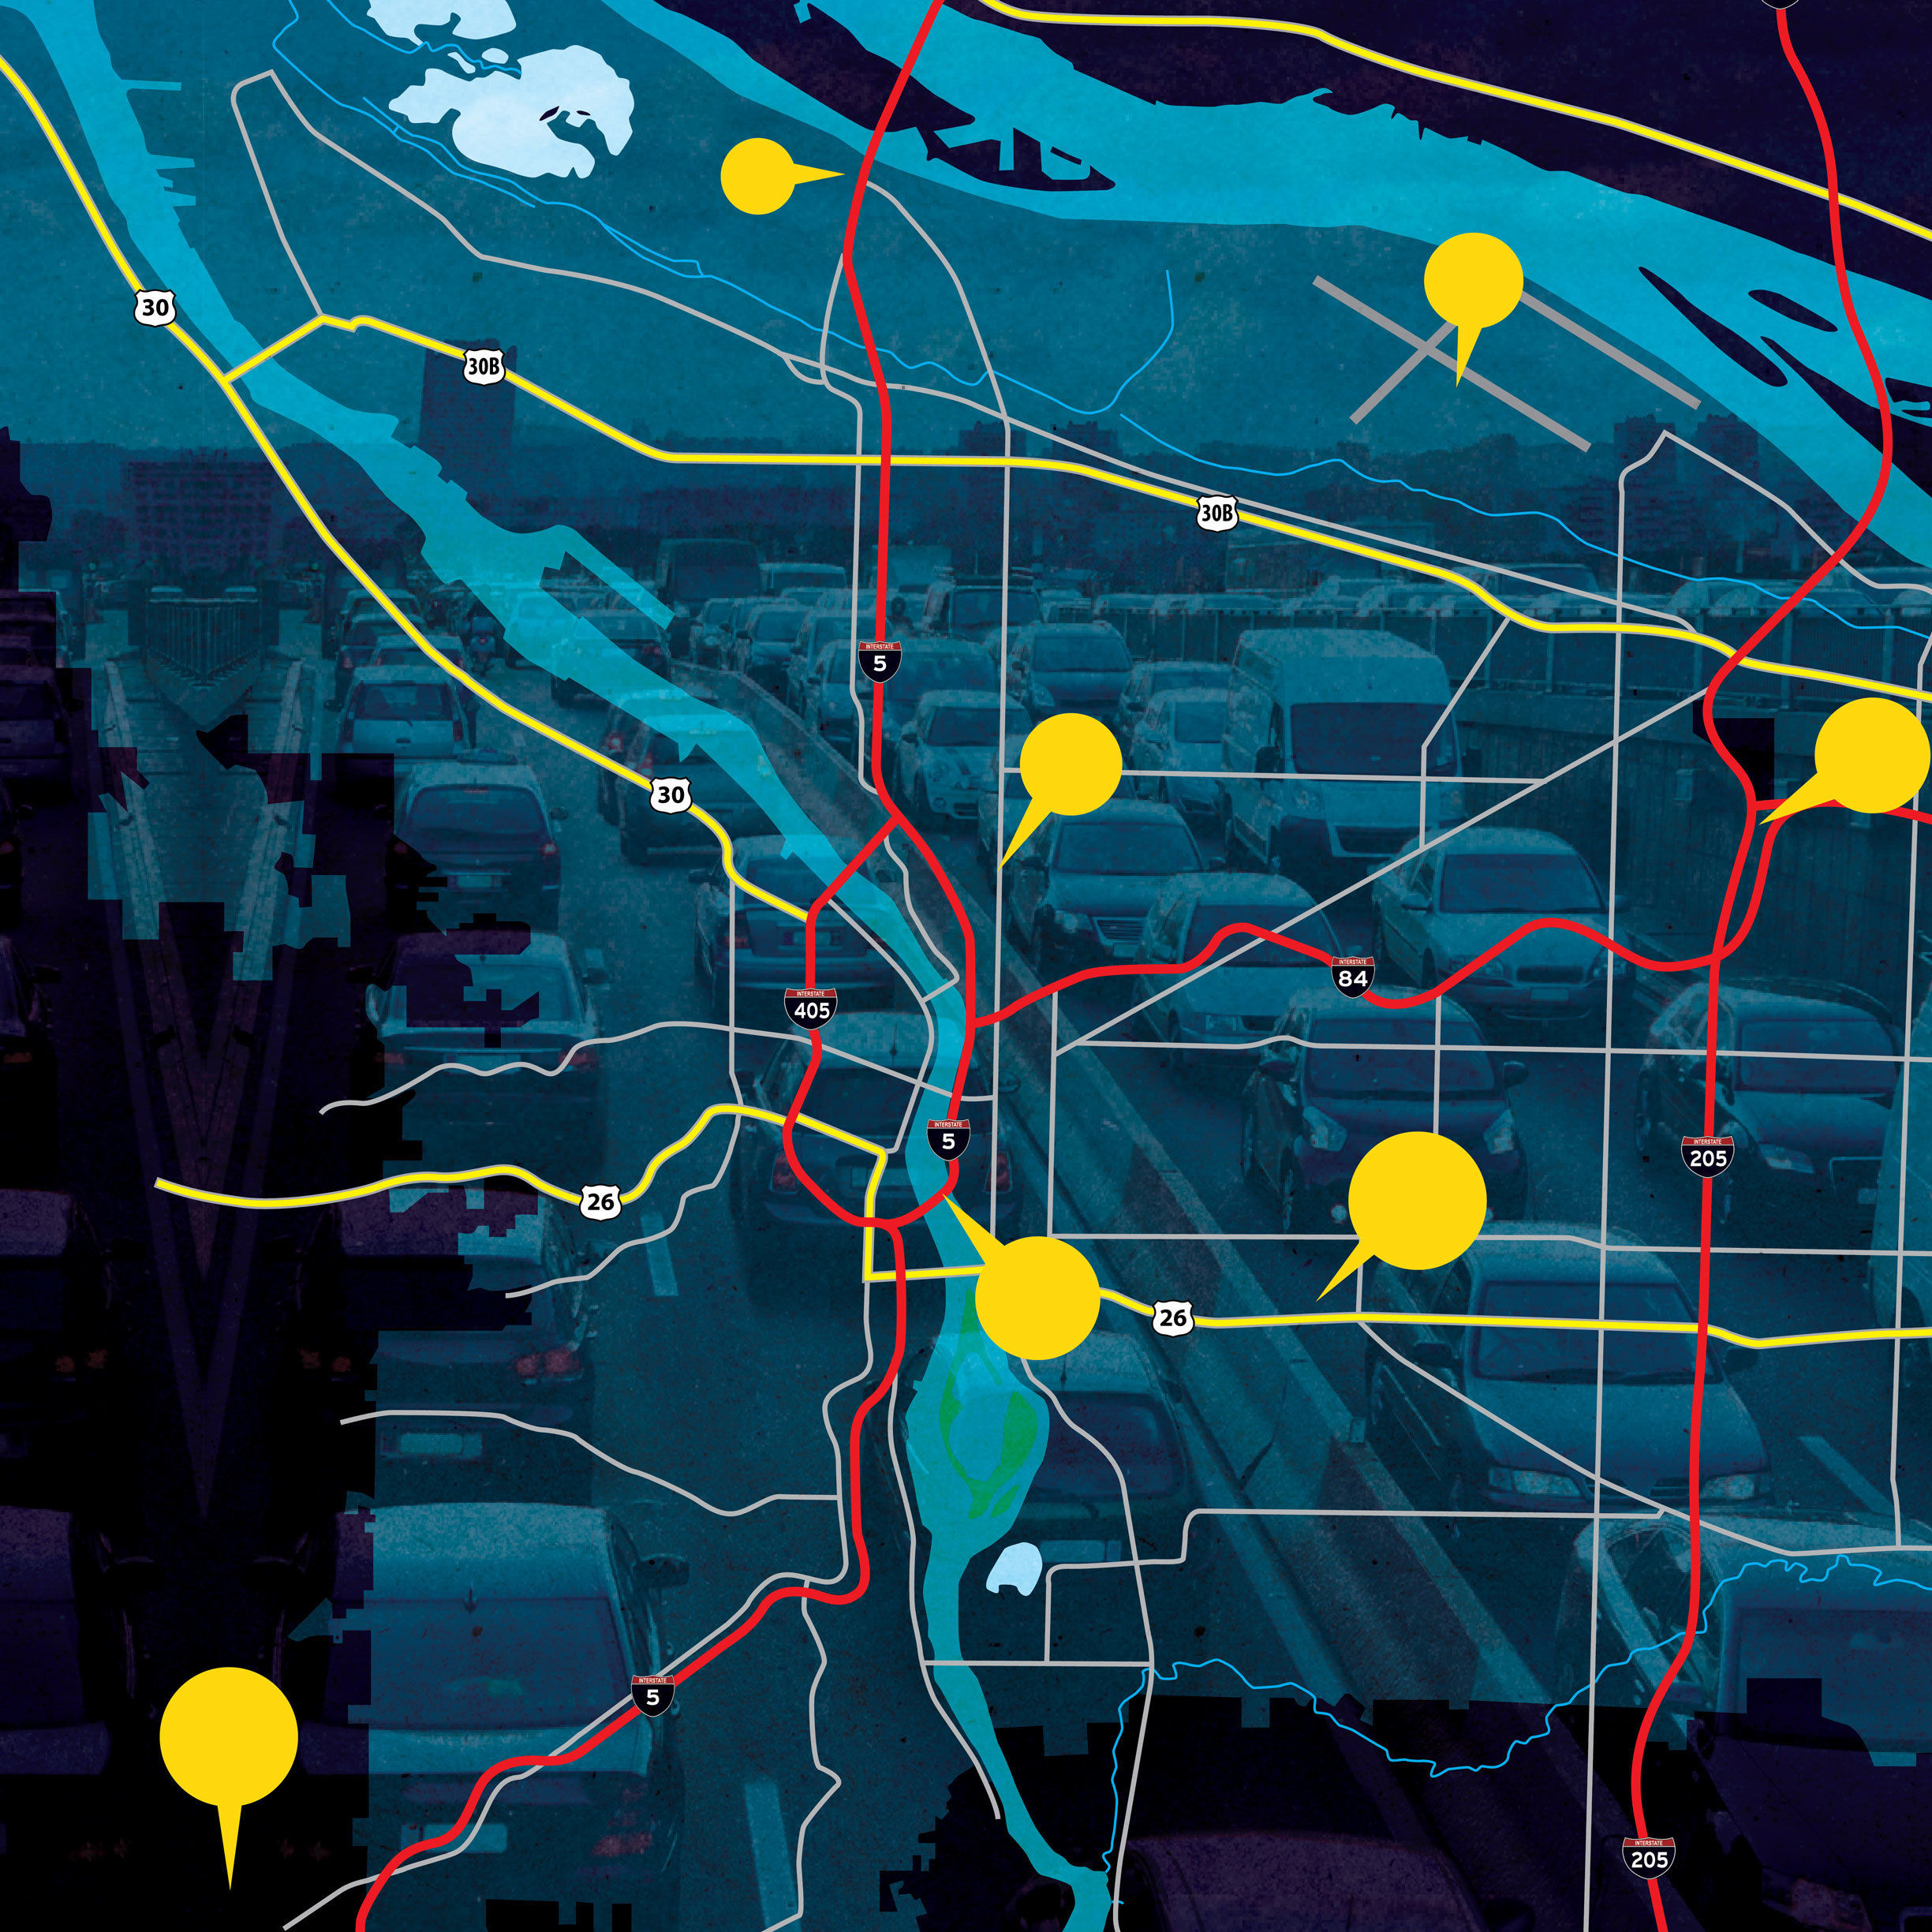
Portland median home sale prices surged more than 11 percent this past year. But even more dramatic increases—24 percent in Parkrose?!—percolated along the city’s outer east side, west side, and industrial fringes. The lesson: if you want to understand Portland’s market, you have to study the whole map.
Welcome to our annual quick reference guide to 122 Portland neighborhoods and suburbs.
Click on our heat map below for details!
Map Legend: Change in Median Home Price Over 1 Year
-
20% or more increase
-
10 - 19% increase
-
Less than 10% increase
-
Less than 5% increase
-
5% - 9% Decrease
-
10% or more decrease
-
Unreported
Real Estate
| Neighborhood | Average Price | Median Price | Cost per Sq. Ft. (avg) | Days on market (avg) | Homes sold | Condo sales (%) | 1-year Median Price Change (%) | 5-year Median Price Change (%) | Distressed Property Sales (%) | Year built (avg) |
|---|---|---|---|---|---|---|---|---|---|---|
| Alameda | $726,243 | $685,000 | $236 | 27 | 101 | 0.0 | 15.7 | 39.8 | 0.0 | 1931 |
| Arbor Lodge | $410,125 | $393,100 | $196 | 21 | 154 | 0.6 | 13.9 | 60.4 | 3.2 | 1951 |
| Ardenwald/Johnson Creek | $290,140 | $295,975 | $156 | 29 | 74 | 0.0 | -8.6 | 0.3 | 8.1 | 1948 |
| Argay | $267,606 | $265,300 | $129 | 44 | 77 | 18.2 | 0.9 | 30.7 | 10.4 | 1969 |
| Arlington Heights | $778,832 | $629,875 | $261 | 51 | 14 | 0.0 | -20.3 | -3.1 | 7.1 | 1961 |
| Arnold Creek | $550,496 | $522,000 | $184 | 48 | 62 | 0.0 | 19.3 | 30.7 | 1.6 | 1984 |
| Ashcreek | $395,927 | $377,500 | $180 | 33 | 136 | 0.0 | 9.4 | 46.6 | 2.2 | 1971 |
| Beaumont-Wilshire | $598,216 | $550,000 | $244 | 21 | 99 | 0.0 | 7.4 | 54.3 | 3.0 | 1943 |
| Boise | $470,539 | $450,000 | $237 | 18 | 47 | 4.3 | 10.6 | 64.8 | 0.0 | 1951 |
| Brentwood/Darlington | $244,671 | $240,000 | $187 | 28 | 280 | 2.9 | 14.3 | 81.8 | 7.9 | 1954 |
| Bridgeton | $268,991 | $250,000 | $179 | 116 | 35 | 17.1 | -1.2 | 119.3 | 0.0 | 1986 |
| Bridlemile | $561,158 | $517,600 | $220 | 38 | 104 | 1.0 | 6.4 | 31.0 | 3.8 | 1968 |
| Brooklyn | $381,014 | $374,750 | $197 | 27 | 38 | 0.0 | 3.4 | 46.1 | 7.9 | 1939 |
| Buckman | $484,272 | $475,000 | $207 | 23 | 49 | 20.4 | 14.5 | 53.2 | 4.1 | 1923 |
| Cathedral Park | $310,559 | $285,000 | $186 | 21 | 96 | 19.8 | 9.6 | 54.1 | 5.2 | 1939 |
| Centennial | $217,095 | $217,500 | $142 | 40 | 351 | 6.3 | 19.9 | 63.7 | 12.0 | 1968 |
| Collins View | $456,463 | $408,500 | $201 | 33 | 44 | 0.0 | 13.8 | 70.9 | 2.3 | 1971 |
| Concordia | $421,942 | $417,000 | $212 | 18 | 213 | 4.2 | 9.7 | 55.6 | 2.8 | 1949 |
| Creston-Kenilworth | $379,154 | $379,450 | $198 | 23 | 138 | 8.7 | 13.3 | 72.5 | 3.6 | 1933 |
| Crestwood | $371,189 | $343,240 | $204 | 23 | 50 | 0.0 | 10.7 | 34.5 | 4.0 | 1974 |
| Cully | $304,667 | $297,000 | $192 | 36 | 191 | 4.2 | 23.8 | 57.1 | 5.8 | 1957 |
| Downtown | $412,126 | $353,000 | $396 | 47 | 164 | 99.4 | 8.8 | 25.8 | 3.7 | 1980 |
| Dunthorpe | $1,137,347 | $1,192,500 | $253 | 72 | 34 | 0.0 | — | — | 8.8 | 1962 |
| East Columbia | $290,723 | $270,000 | $156 | 42 | 41 | 0.0 | 42.1 | 58.8 | 7.3 | 1988 |
| Eastmoreland | $678,508 | $664,979 | $226 | 28 | 110 | 0.0 | 8.7 | 56.5 | 0.9 | 1940 |
| Eliot | $450,173 | $456,000 | $212 | 24 | 31 | 12.9 | 22.4 | 60.3 | 3.2 | 1888 |
| Far Southwest | $446,873 | $421,450 | $179 | 46 | 40 | 0.0 | 32.9 | 30.8 | 2.5 | 1975 |
| Forest Park | $787,807 | $723,220 | $227 | 63 | 61 | 0.0 | -3.7 | 26.9 | 3.3 | 1982 |
| Foster-Powell | $283,860 | $283,500 | $175 | 31 | 154 | 0.0 | 11.2 | 62.0 | 8.4 | 1924 |
| Glenfair | $224,178 | $221,500 | $132 | 59 | 27 | 0.0 | 11.0 | 41.1 | 25.9 | 1968 |
| Goose Hollow | $395,665 | $302,000 | $322 | 39 | 119 | 93.3 | 14.5 | 51.0 | 4.2 | 1976 |
| Grant Park | $645,943 | $599,450 | $233 | 25 | 50 | 0.0 | 4.6 | 27.3 | 0.0 | 1926 |
| Hayden Island | $294,931 | $240,000 | $188 | 123 | 77 | 50.6 | 39.5 | 1.1 | 3.9 | 1977 |
| Hayhurst | $422,203 | $409,000 | $198 | 39 | 113 | 6.2 | 13.6 | 38.6 | 4.4 | 1963 |
| Hazelwood | $227,994 | $224,950 | $148 | 38 | 326 | 11.7 | 17.2 | 47.5 | 9.5 | 1966 |
| Healy Heights | $639,900 | $639,900 | $177 | 7 | 2 | 0.0 | -28.9 | -21.5 | 0.0 | 1960 |
| Hillsdale | $509,575 | $500,000 | $209 | 38 | 157 | 7.0 | 25.0 | 48.7 | 3.2 | 1961 |
| Hillside | $752,405 | $645,000 | $327 | 47 | 83 | 54.2 | -3.0 | 28.5 | 3.6 | 1976 |
| Hollywood | $478,082 | $456,500 | $206 | 38 | 21 | 28.6 | 12.4 | 69.4 | 4.8 | 1939 |
| Homestead | $346,047 | $299,000 | $218 | 59 | 29 | 44.8 | -11.8 | 18.4 | 0.0 | 1962 |
| Hosford-Abernethy | $493,713 | $470,000 | $241 | 22 | 86 | 26.7 | 2.2 | 35.4 | 1.2 | 1937 |
| Humboldt | $447,840 | $418,075 | $207 | 27 | 86 | 5.8 | 8.6 | 41.7 | 2.3 | 1950 |
| Irvington | $632,224 | $657,000 | $245 | 27 | 91 | 26.4 | 9.7 | 28.3 | 0.0 | 1937 |
| Kenton | $318,195 | $307,000 | $208 | 15 | 191 | 0.0 | 13.7 | 53.6 | 6.3 | 1953 |
| Kerns | $421,957 | $430,000 | $243 | 19 | 36 | 36.1 | 21.6 | 48.3 | 5.6 | 1937 |
| King | $421,019 | $405,000 | $212 | 21 | 118 | 6.8 | 16.7 | 51.1 | 3.4 | 1943 |
| Laurelhurst | $654,275 | $649,900 | $221 | 26 | 89 | 0.0 | 19.5 | 50.0 | 1.1 | 1927 |
| Lents | $224,005 | $220,000 | $149 | 37 | 358 | 2.0 | 18.6 | 80.3 | 14.2 | 1960 |
| Linnton | $390,828 | $382,000 | $185 | 33 | 18 | 16.7 | 38.9 | 85.4 | 0.0 | 1939 |
| Lloyd District | $242,500 | $180,500 | $278 | 20 | 6 | 83.3 | -3.2 | 71.1 | 0.0 | 1985 |
| Madison South | $267,159 | $259,900 | $168 | 33 | 102 | 3.9 | 16.0 | 59.1 | 9.8 | 1957 |
| Maplewood | $409,857 | $420,750 | $205 | 29 | 64 | 3.1 | 10.7 | 45.3 | 3.1 | 1963 |
| Markham | $361,846 | $362,450 | $182 | 32 | 84 | 2.4 | 8.5 | 35.7 | 7.1 | 1966 |
| Marshall Park | $492,642 | $487,500 | $182 | 34 | 34 | 0.0 | 14.3 | 52.8 | 0.0 | 1966 |
| Mill Park | $223,976 | $229,995 | $139 | 38 | 124 | 23.4 | 27.2 | 73.6 | 10.5 | 1970 |
| Montavilla | $283,055 | $278,000 | $185 | 25 | 327 | 8.0 | 13.5 | 63.5 | 6.1 | 1941 |
| Mt Scott-Arleta | $301,724 | $295,000 | $187 | 27 | 201 | 0.0 | 20.4 | 60.8 | 5.0 | 1938 |
| Mt Tabor | $542,298 | $514,000 | $218 | 31 | 164 | 9.8 | 17.5 | 46.9 | 0.6 | 1947 |
| Multnomah | $373,707 | $360,000 | $213 | 32 | 149 | 26.2 | 7.6 | 36.4 | 3.4 | 1969 |
| North Tabor | $406,440 | $389,925 | $189 | 24 | 74 | 10.8 | 23.8 | 36.6 | 2.7 | 1945 |
| Northwest District | $461,827 | $400,000 | $333 | 29 | 228 | 75.4 | -1.2 | 17.5 | 2.2 | 1949 |
| Northwest Heights | $606,631 | $571,940 | $210 | 59 | 190 | 20.5 | -2.2 | 10.5 | 3.2 | 1991 |
| Old Town/Chinatown | $263,422 | $254,350 | $321 | 57 | 46 | 97.8 | 9.4 | 74.2 | 2.2 | 1942 |
| Overlook | $385,059 | $378,000 | $213 | 16 | 117 | 21.4 | 6.5 | 24.8 | 2.6 | 1947 |
| Parkrose | $235,272 | $240,000 | $142 | 35 | 72 | 6.9 | 23.6 | 73.9 | 11.1 | 1950 |
| Parkrose Heights | $244,924 | $245,000 | $146 | 47 | 101 | 0.0 | 18.6 | 64.5 | 13.9 | 1954 |
| Pearl District | $551,844 | $464,000 | $468 | 44 | 308 | 99.4 | 5.7 | 31.1 | 1.0 | 1988 |
| Piedmont | $369,907 | $370,000 | $188 | 18 | 175 | 8.6 | 14.7 | 74.1 | 5.1 | 1944 |
| Pleasant Valley | $335,709 | $330,000 | $145 | 58 | 180 | 1.7 | 14.8 | 40.1 | 8.9 | 1990 |
| Portsmouth | $280,543 | $275,000 | $188 | 22 | 177 | 1.7 | 10.0 | 53.6 | 10.7 | 1964 |
| Powellhurst-Gilbert | $208,450 | $205,500 | $137 | 51 | 356 | 12.6 | 10.8 | 52.2 | 13.2 | 1972 |
| Reed | $433,388 | $399,950 | $218 | 25 | 48 | 0.0 | 11.9 | 42.4 | 2.1 | 1957 |
| Richmond | $499,097 | $465,000 | $224 | 21 | 205 | 8.3 | 11.5 | 50.2 | 2.0 | 1941 |
| Rose City Park | $474,540 | $456,600 | $205 | 19 | 161 | 2.5 | 8.6 | 42.9 | 0.0 | 1917 |
| Roseway | $345,515 | $350,000 | $195 | 15 | 160 | 0.0 | 19.9 | 50.2 | 3.1 | 1944 |
| Russell | $261,992 | $257,700 | $143 | 34 | 66 | 0.0 | 14.5 | 48.3 | 10.6 | 1958 |
| Sabin | $601,490 | $582,500 | $240 | 16 | 70 | 1.4 | 25.3 | 58.7 | 0.0 | 1937 |
| Sellwood-Moreland | $486,757 | $450,500 | $233 | 28 | 228 | 13.6 | 10.9 | 40.1 | 2.2 | 1949 |
| South Burlingame | $424,898 | $420,000 | $186 | 37 | 60 | 0.0 | 5.3 | 42.1 | 5.0 | 1954 |
| South Portland | $445,368 | $385,000 | $286 | 34 | 217 | 61.3 | 7.0 | 40.0 | 2.8 | 1981 |
| South Tabor | $364,818 | $353,000 | $198 | 21 | 124 | 4.0 | 15.4 | 46.6 | 0.8 | 1952 |
| Southwest Hills | $809,218 | $699,000 | $255 | 65 | 172 | 15.7 | 9.2 | 25.5 | 5.8 | 1939 |
| St. Johns | $274,302 | $265,000 | $186 | 24 | 290 | 7.2 | 16.7 | 72.1 | 7.6 | 1963 |
| Sullivan's Gulch | $367,672 | $350,000 | $235 | 38 | 57 | 66.7 | 34.6 | 78.1 | 7.0 | 1962 |
| Sumner | $217,350 | $217,500 | $167 | 23 | 43 | 0.0 | 17.6 | 79.8 | 14.0 | 1939 |
| Sunderland | $221,988 | $227,500 | $138 | 108 | 4 | 0.0 | — | 145.8 | 0.0 | 1953 |
| Sunnyside | $481,465 | $459,250 | $240 | 26 | 84 | 21.4 | 16.4 | 55.7 | 1.2 | 1933 |
| Sylvan-Highlands | $655,236 | $583,500 | $228 | 48 | 41 | 17.1 | 22.5 | 91.5 | 7.3 | 1971 |
| University Park | $378,934 | $368,000 | $190 | 29 | 97 | 0.0 | 15.8 | 31.4 | 1.0 | 1953 |
| Vernon | $423,731 | $413,040 | $203 | 17 | 49 | 8.2 | 10.2 | 55.9 | 6.1 | 1937 |
| West Portland Park | $322,320 | $333,250 | $182 | 31 | 74 | 14.9 | 11.3 | 37.1 | 13.5 | 1979 |
| Wilkes | $249,296 | $255,000 | $147 | 39 | 194 | 15.5 | 6.3 | 43.3 | 6.2 | 1981 |
| Woodland Park | $236,400 | $245,000 | $126 | 35 | 5 | 0.0 | 34.2 | 71.6 | 0.0 | 1945 |
| Woodlawn | $373,950 | $352,500 | $206 | 21 | 107 | 3.7 | 13.7 | 64.7 | 2.8 | 1956 |
| Woodstock | $403,180 | $390,000 | $211 | 27 | 189 | 1.1 | 21.1 | 62.5 | 2.1 | 1956 |
People
| Neighborhood | Adjusted Population | Adjusted Population Density (people per sq. mi) | Median Age | Median Household Income | % Home Ownership | % Married (except separated) | % Divorced | % Widowed | % Separated | % Never Married | % Population with Bachelor Degree as Highest Level of Education (25 and older) | % Population with Graduate Degree | Median gross rent | % People Below Federal Poverty Level | % Unemployed (16 years and older) | % English as only language | % Households with one or more people under 18 | % Population in same house last year | % Population in different county last year | % Population in different state last year | % Population in different state or Oregon county last year |
|---|---|---|---|---|---|---|---|---|---|---|---|---|---|---|---|---|---|---|---|---|---|
| Alameda | 5,465 | 9,246 | 40 | $99,682 | 77 | 53.8 | 9.9 | 3.1 | 0.6 | 32.7 | 38.9 | 32.4 | $1,457 | 8.1 | 6.3 | 93.5 | 51.9 | 87.7 | 0.5 | 0.6 | 1.1 |
| Arbor Lodge | 6,449 | 7,703 | 37 | $59,304 | 68 | 45.8 | 13.5 | 3.4 | 1.0 | 36.3 | 29.0 | 16.3 | $1,132 | 15.6 | 7.5 | 82.7 | 47.2 | 85.8 | 2.3 | 1.8 | 4.1 |
| Ardenwald/Johnson Creek | 1,357 | 6,855 | 41 | $58,027 | 64 | 49.6 | 16.8 | 8.0 | 2.2 | 23.5 | 17.9 | 16.7 | $993 | 11.6 | 5.4 | 90.4 | 39.8 | 90.0 | 2.8 | 2.0 | 4.7 |
| Argay | 6,384 | 7,194 | 36 | $41,138 | 57 | 30.5 | 19.1 | 4.2 | 5.1 | 41.1 | 11.1 | 4.5 | $855 | 24.7 | 14.8 | 78.8 | 55.6 | 58.5 | 12.5 | 4.5 | 17.0 |
| Arlington Heights | 1,083 | 5,364 | 48 | $118,110 | 72 | 59.3 | 7.8 | 6.2 | 0.3 | 26.4 | 42.2 | 41.8 | $958 | 5.3 | 3.8 | 89.2 | 31.6 | 78.8 | 1.3 | 1.3 | 2.6 |
| Arnold Creek | 3,190 | 3,096 | 44 | $113,463 | 91 | 60.0 | 10.8 | 3.2 | 0.9 | 25.0 | 34.9 | 31.4 | $1,551 | 3.1 | 7.2 | 92.8 | 41.7 | 91.4 | 3.9 | 2.6 | 6.5 |
| Ashcreek | 5,469 | 4,741 | 41 | $80,002 | 75 | 58.0 | 9.5 | 4.4 | 1.8 | 26.4 | 31.2 | 25.8 | $1,315 | 8.9 | 8.0 | 88.5 | 42.3 | 87.7 | 2.8 | 2.4 | 5.2 |
| Beaumont-Wilshire | 5,930 | 8,122 | 40 | $93,970 | 84 | 52.6 | 10.4 | 4.0 | 2.1 | 30.8 | 33.9 | 29.8 | $1,437 | 6.7 | 5.4 | 92.0 | 47.0 | 87.7 | 0.9 | 0.8 | 1.7 |
| Boise | 3,919 | 10,606 | 33 | $54,540 | 38 | 28.0 | 10.7 | 3.0 | 0.7 | 57.5 | 35.8 | 16.6 | $1,078 | 17.5 | 5.8 | 88.8 | 48.0 | 73.6 | 1.7 | 1.6 | 3.3 |
| Brentwood/Darlington | 13,215 | 8,272 | 36 | $49,579 | 67 | 44.9 | 14.0 | 3.8 | 1.7 | 35.5 | 16.7 | 6.5 | $1,037 | 21.6 | 13.1 | 70.1 | 51.5 | 81.3 | 4.1 | 3.1 | 7.3 |
| Bridgeton | 395 | 2,818 | 40 | $56,516 | 70 | 47.3 | 16.2 | 3.4 | 3.7 | 29.5 | 14.4 | 9.8 | $1,248 | 13.5 | 11.6 | 83.5 | 35.7 | 82.9 | 5.4 | 6.2 | 11.6 |
| Bridlemile | 4,740 | 4,349 | 45 | $92,937 | 71 | 56.5 | 12.2 | 4.3 | 1.4 | 25.7 | 35.7 | 36.3 | $856 | 9.5 | 10.2 | 86.3 | 49.7 | 85.9 | 5.0 | 3.4 | 8.4 |
| Brooklyn | 5,166 | 7,966 | 37 | $57,277 | 45 | 42.5 | 13.5 | 3.6 | 0.9 | 39.4 | 29.8 | 26.3 | $957 | 15.6 | 6.4 | 89.9 | 46.6 | 81.3 | 3.1 | 2.2 | 5.3 |
| Buckman | 7,943 | 10,814 | 33 | $33,825 | 17 | 17.8 | 15.5 | 2.9 | 1.9 | 61.9 | 37.2 | 16.6 | $818 | 22.0 | 9.8 | 91.2 | 32.3 | 66.2 | 4.7 | 3.1 | 7.8 |
| Cathedral Park | 3,823 | 8,289 | 37 | $42,454 | 54 | 37.3 | 14.5 | 4.0 | 3.2 | 41.0 | 27.3 | 14.6 | $896 | 21.1 | 9.4 | 79.8 | 44.9 | 81.9 | 1.7 | 1.4 | 3.1 |
| Centennial | 25,273 | 8,404 | 34 | $40,314 | 58 | 42.2 | 12.4 | 6.3 | 3.2 | 35.8 | 9.4 | 2.6 | $944 | 30.9 | 15.7 | 68.3 | 51.6 | 82.5 | 3.5 | 2.4 | 5.9 |
| Collins View | 2,544 | 4,127 | 29 | $103,785 | 81 | 39.9 | 10.7 | 2.2 | 1.0 | 46.2 | 34.1 | 40.9 | $1,373 | 7.4 | 8.0 | 92.1 | 42.2 | 79.4 | 2.0 | 1.0 | 3.0 |
| Concordia | 9,445 | 8,396 | 39 | $73,474 | 74 | 46.1 | 11.0 | 3.5 | 1.5 | 37.9 | 33.2 | 22.1 | $1,236 | 11.0 | 8.6 | 88.9 | 38.9 | 83.7 | 2.0 | 1.6 | 3.6 |
| Creston-Kenilworth | 8,229 | 10,982 | 34 | $44,587 | 33 | 29.6 | 15.9 | 2.1 | 1.6 | 50.8 | 24.5 | 12.5 | $896 | 23.0 | 10.7 | 80.7 | 44.6 | 76.6 | 5.4 | 4.5 | 9.9 |
| Crestwood | 1,176 | 4,686 | 42 | $83,351 | 80 | 59.6 | 8.7 | 4.4 | 1.9 | 25.5 | 31.6 | 26.6 | $1,383 | 8.9 | 8.2 | 88.8 | 43.2 | 88.6 | 2.1 | 2.2 | 4.2 |
| Cully | 14,223 | 7,299 | 36 | $40,144 | 57 | 32.9 | 17.5 | 3.9 | 4.1 | 41.6 | 14.2 | 6.8 | $853 | 27.1 | 12.3 | 72.0 | 56.3 | 72.2 | 7.9 | 2.9 | 10.8 |
| Downtown | 10,836 | 14,142 | 37 | $31,329 | 15 | 17.3 | 14.9 | 3.9 | 2.9 | 61.0 | 29.3 | 20.9 | $914 | 27.2 | 19.3 | 82.0 | 19.2 | 50.9 | 11.3 | 4.5 | 15.8 |
| Dunthorpe | 1,767 | 1,485 | 29 | $103,397 | 80 | 39.7 | 10.7 | 2.3 | 3.7 | 46.3 | 34.0 | 40.8 | $1,372 | 7.5 | 8.0 | 92.1 | 42.2 | 79.3 | 2.0 | 1.0 | 3.0 |
| East Columbia | 2,151 | 2,819 | 39 | $56,375 | 70 | 47.1 | 16.3 | 3.4 | 0.9 | 29.6 | 14.3 | 9.8 | $1,247 | 13.5 | 11.6 | 83.5 | 35.9 | 82.6 | 5.5 | 6.2 | 11.7 |
| Eastmoreland | 4,937 | 7,289 | 39 | $78,526 | 68 | 54.8 | 8.7 | 3.9 | 3.1 | 31.8 | 29.2 | 27.1 | $1,468 | 11.1 | 7.2 | 92.4 | 41.7 | 80.4 | 2.8 | 1.8 | 4.7 |
| Eliot | 3,297 | 6,206 | 36 | $42,604 | 28 | 21.2 | 14.4 | 5.0 | 1.7 | 56.2 | 26.6 | 19.4 | $911 | 29.9 | 10.3 | 89.7 | 41.9 | 73.2 | 3.4 | 2.1 | 5.5 |
| Far Southwest | 1,890 | 5,039 | 48 | $74,225 | 62 | 58.2 | 14.2 | 4.8 | 1.2 | 21.2 | 35.7 | 28.7 | $1,155 | 5.1 | 4.4 | 87.8 | 33.6 | 83.4 | 8.2 | 3.6 | 11.9 |
| Forest Park | 2,702 | 1,248 | 43 | $117,085 | 82 | 64.9 | 12.7 | 4.3 | 1.6 | 16.8 | 36.3 | 31.5 | $1,627 | 5.2 | 6.4 | 85.2 | 44.7 | 87.0 | 4.8 | 3.7 | 8.6 |
| Foster-Powell | 7,554 | 8,841 | 37 | $50,743 | 54 | 39.6 | 13.7 | 5.5 | 3.7 | 39.4 | 25.5 | 8.7 | $1,015 | 16.9 | 9.5 | 80.9 | 47.2 | 78.5 | 2.2 | 2.3 | 4.4 |
| Glenfair | 3,067 | 10,472 | 32 | $43,256 | 36 | 50.2 | 12.0 | 5.4 | 1.2 | 28.8 | 12.9 | 5.7 | $879 | 24.1 | 6.9 | 58.9 | 55.8 | 83.5 | 1.1 | 0.9 | 2.0 |
| Goose Hollow | 5,088 | 16,627 | 37 | $54,630 | 14 | 27.4 | 12.6 | 2.8 | 0.8 | 55.9 | 32.5 | 31.0 | $941 | 25.6 | 7.1 | 89.8 | 26.2 | 66.8 | 3.9 | 2.3 | 6.2 |
| Grant Park | 3,721 | 9,242 | 39 | $96,186 | 69 | 54.9 | 9.3 | 2.6 | 2.8 | 32.5 | 33.8 | 30.9 | $1,508 | 6.7 | 5.0 | 92.2 | 50.5 | 85.1 | 0.8 | 1.0 | 1.8 |
| Hayden Island | 807 | 1,207 | 58 | $44,715 | 86 | 31.7 | 29.9 | 11.3 | 0.7 | 24.3 | 23.0 | 13.2 | $866 | 14.5 | 11.2 | 92.8 | 21.0 | 91.9 | 0.7 | 1.0 | 1.7 |
| Hayhurst | 5,845 | 5,677 | 40 | $63,999 | 59 | 45.6 | 16.8 | 8.8 | 1.9 | 28.1 | 33.4 | 24.2 | $1,204 | 8.9 | 9.7 | 93.4 | 48.0 | 81.1 | 5.4 | 4.2 | 9.6 |
| Hazelwood | 24,636 | 7,097 | 36 | $40,858 | 45 | 40.0 | 13.2 | 8.9 | 0.0 | 36.0 | 14.7 | 6.8 | $900 | 23.1 | 8.8 | 68.4 | 46.4 | 84.8 | 1.5 | 1.2 | 2.7 |
| Healy Heights | 269 | 4,739 | 41 | $95,956 | 59 | 57.6 | 6.8 | 4.4 | 0.7 | 31.2 | 34.0 | 44.2 | $931 | 11.1 | 6.6 | 86.0 | 31.1 | 79.7 | 3.9 | 2.5 | 6.4 |
| Hillsdale | 8,366 | 5,012 | 41 | $86,403 | 66 | 49.6 | 12.9 | 4.3 | 0.6 | 32.5 | 36.9 | 33.9 | $1,069 | 10.5 | 8.2 | 92.1 | 43.5 | 82.5 | 3.7 | 2.4 | 6.1 |
| Hillside | 2,219 | 4,558 | 46 | $122,529 | 68 | 62.4 | 7.9 | 5.7 | 0.8 | 23.4 | 41.2 | 39.3 | $1,236 | 5.8 | 4.7 | 86.3 | 38.3 | 81.1 | 3.1 | 2.5 | 5.6 |
| Hollywood | 2,078 | 8,779 | 40 | $65,728 | 46 | 40.6 | 16.9 | 5.4 | 0.3 | 36.3 | 30.3 | 27.2 | $1,060 | 15.5 | 6.1 | 90.4 | 48.2 | 83.2 | 1.9 | 1.4 | 3.3 |
| Homestead | 1,985 | 4,654 | 39 | $84,036 | 57 | 49.5 | 7.1 | 3.7 | 0.9 | 39.3 | 39.6 | 41.1 | $995 | 14.4 | 7.1 | 88.2 | 36.2 | 76.8 | 5.0 | 3.0 | 8.1 |
| Hosford-Abernethy | 7,725 | 9,818 | 35 | $55,646 | 46 | 33.0 | 12.7 | 2.6 | 1.3 | 50.8 | 34.6 | 25.2 | $931 | 15.0 | 7.6 | 90.7 | 39.5 | 77.6 | 2.7 | 2.0 | 4.7 |
| Humboldt | 4,922 | 9,436 | 34 | $50,454 | 47 | 29.1 | 11.6 | 2.8 | 1.4 | 55.3 | 32.2 | 17.0 | $1,006 | 26.9 | 9.4 | 89.4 | 52.0 | 70.3 | 2.7 | 1.9 | 4.6 |
| Irvington | 5,864 | 9,477 | 39 | $82,644 | 55 | 45.1 | 11.5 | 3.5 | 3.2 | 38.4 | 31.2 | 33.8 | $1,370 | 9.0 | 7.6 | 92.2 | 43.8 | 84.7 | 0.9 | 1.2 | 2.1 |
| Kenton | 7,860 | 7,873 | 38 | $54,927 | 64 | 47.2 | 14.9 | 3.8 | 2.4 | 31.0 | 17.1 | 10.4 | $1,156 | 16.8 | 11.1 | 82.1 | 37.2 | 83.9 | 4.1 | 4.7 | 8.8 |
| Kerns | 5,951 | 9,227 | 32 | $38,792 | 25 | 21.7 | 13.3 | 1.9 | 2.0 | 60.6 | 38.4 | 17.3 | $874 | 22.6 | 9.4 | 91.0 | 48.3 | 68.4 | 5.1 | 2.7 | 7.8 |
| King | 6,615 | 10,837 | 32 | $56,078 | 50 | 27.8 | 11.7 | 3.0 | 1.2 | 55.5 | 37.0 | 19.0 | $1,107 | 20.3 | 8.4 | 89.0 | 49.1 | 75.3 | 1.4 | 1.2 | 2.5 |
| Laurelhurst | 4,662 | 7,580 | 44 | $98,823 | 82 | 62.0 | 11.4 | 5.1 | 1.6 | 20.3 | 34.2 | 41.4 | $1,001 | 5.1 | 7.4 | 92.9 | 54.1 | 91.3 | 0.5 | 0.4 | 0.9 |
| Lents | 20,231 | 7,183 | 34 | $41,090 | 53 | 45.0 | 13.3 | 4.6 | 1.6 | 35.5 | 12.8 | 4.0 | $944 | 22.3 | 11.1 | 66.2 | 54.1 | 83.0 | 4.0 | 2.8 | 6.8 |
| Linnton | 417 | 1,072 | 47 | $83,279 | 79 | 56.7 | 21.3 | 3.5 | 4.2 | 16.9 | 29.2 | 23.4 | $1,472 | 6.4 | 7.0 | 93.5 | 32.7 | 88.8 | 1.9 | 1.7 | 3.6 |
| Lloyd District | 2,417 | 5,407 | 37 | $40,567 | 21 | 22.3 | 14.8 | 6.4 | 2.8 | 52.2 | 28.4 | 22.2 | $987 | 22.7 | 11.6 | 92.7 | 29.8 | 68.7 | 3.5 | 2.1 | 5.5 |
| Madison South | 7,755 | 6,171 | 37 | $53,734 | 61 | 40.8 | 13.2 | 3.6 | 0.2 | 39.8 | 22.0 | 13.0 | $1,073 | 16.7 | 8.0 | 84.5 | 43.0 | 85.1 | 0.8 | 0.6 | 1.4 |
| Maplewood | 2,610 | 4,577 | 50 | $91,429 | 71 | 57.1 | 15.7 | 9.1 | 0.5 | 17.9 | 40.7 | 25.7 | $1,023 | 4.8 | 6.6 | 92.7 | 41.3 | 85.8 | 5.7 | 3.6 | 9.3 |
| Markham | 2,004 | 3,984 | 43 | $98,204 | 84 | 56.8 | 10.8 | 3.7 | 0.9 | 28.2 | 35.9 | 28.7 | $1,444 | 8.5 | 9.8 | 91.9 | 40.6 | 87.2 | 5.1 | 3.0 | 8.2 |
| Marshall Park | 1,697 | 3,363 | 39 | $111,548 | 91 | 53.6 | 10.7 | 2.8 | 3.1 | 32.0 | 34.6 | 34.5 | $1,506 | 4.0 | 7.6 | 92.7 | 42.1 | 87.8 | 3.2 | 2.1 | 5.3 |
| Mill Park | 9,399 | 10,199 | 33 | $36,219 | 35 | 38.5 | 12.1 | 7.0 | 2.0 | 39.4 | 15.0 | 7.8 | $865 | 31.4 | 6.6 | 57.3 | 55.1 | 82.0 | 1.7 | 1.9 | 3.6 |
| Montavilla | 16,725 | 8,117 | 35 | $51,669 | 55 | 39.1 | 14.1 | 4.8 | 2.5 | 39.9 | 24.5 | 11.0 | $1,037 | 19.4 | 11.7 | 77.0 | 43.6 | 78.2 | 2.6 | 1.7 | 4.4 |
| Mt Scott-Arleta | 7,193 | 8,567 | 38 | $51,811 | 58 | 42.0 | 13.8 | 3.5 | 1.7 | 38.3 | 21.8 | 9.3 | $1,003 | 13.6 | 9.6 | 84.4 | 46.0 | 84.3 | 2.0 | 2.1 | 4.1 |
| Mt Tabor | 10,052 | 7,935 | 42 | $65,326 | 64 | 47.2 | 13.1 | 4.8 | 1.0 | 33.1 | 34.8 | 21.8 | $948 | 7.9 | 6.4 | 87.5 | 36.0 | 80.6 | 3.7 | 2.1 | 5.8 |
| Multnomah | 7,756 | 6,157 | 37 | $59,217 | 46 | 42.6 | 15.8 | 2.7 | 0.4 | 38.5 | 32.7 | 24.7 | $888 | 14.4 | 7.5 | 89.1 | 43.4 | 76.8 | 7.2 | 4.0 | 11.2 |
| North Tabor | 5,558 | 9,553 | 38 | $53,103 | 47 | 32.6 | 17.2 | 5.1 | 1.7 | 43.3 | 32.5 | 15.3 | $878 | 16.7 | 10.4 | 88.4 | 42.5 | 77.7 | 2.2 | 1.7 | 3.8 |
| Northwest District | 14,891 | 14,741 | 37 | $60,143 | 23 | 31.2 | 15.2 | 2.5 | 3.6 | 47.0 | 36.1 | 28.5 | $1,006 | 16.6 | 5.3 | 84.3 | 33.8 | 66.6 | 5.4 | 3.4 | 8.8 |
| Northwest Heights | 1,425 | 1,550 | 42 | $130,220 | 82 | 67.8 | 8.6 | 4.7 | 1.1 | 17.6 | 39.2 | 34.3 | $1,706 | 5.4 | 6.0 | 81.1 | 50.3 | 85.9 | 6.1 | 4.6 | 10.7 |
| Old Town/Chinatown | 3,262 | 17,492 | 42 | $42,122 | 28 | 24.3 | 17.8 | 4.5 | 2.5 | 50.9 | 29.1 | 24.6 | $978 | 23.7 | 17.2 | 90.1 | 23.2 | 59.7 | 5.8 | 2.6 | 8.4 |
| Overlook | 6,593 | 6,377 | 36 | $59,466 | 31 | 38.5 | 12.4 | 2.8 | 2.0 | 44.2 | 32.9 | 18.6 | $1,030 | 18.7 | 26.7 | 89.0 | 44.2 | 81.8 | 1.4 | 1.1 | 2.5 |
| Parkrose | 6,084 | 5,589 | 36 | $37,507 | 48 | 27.0 | 20.0 | 3.0 | 4.7 | 45.4 | 12.2 | 4.0 | $857 | 19.0 | 16.0 | 76.0 | 57.6 | 57.5 | 13.0 | 5.1 | 18.1 |
| Parkrose Heights | 6,304 | 6,811 | 39 | $53,762 | 59 | 41.8 | 13.3 | 7.9 | 1.5 | 35.6 | 18.2 | 6.3 | $938 | 10.7 | 8.0 | 72.5 | 46.7 | 80.3 | 2.7 | 1.9 | 4.5 |
| Pearl District | 5,902 | 16,018 | 38 | $60,481 | 30 | 29.4 | 15.6 | 4.0 | 1.6 | 49.5 | 36.6 | 28.7 | $1,237 | 18.4 | 12.4 | 91.4 | 22.5 | 58.3 | 6.1 | 2.8 | 8.9 |
| Piedmont | 6,928 | 8,769 | 36 | $50,930 | 60 | 36.5 | 11.6 | 6.8 | 1.0 | 44.1 | 29.5 | 16.8 | $981 | 16.7 | 10.3 | 85.2 | 43.7 | 81.3 | 4.5 | 4.7 | 9.2 |
| Pleasant Valley | 8,689 | 4,203 | 37 | $65,761 | 71 | 56.5 | 8.6 | 4.3 | 1.5 | 29.2 | 16.9 | 9.5 | $1,213 | 16.6 | 9.3 | 70.7 | 52.7 | 89.0 | 2.5 | 2.1 | 4.7 |
| Portsmouth | 10,418 | 12,038 | 32 | $41,645 | 45 | 32.3 | 12.1 | 3.4 | 3.8 | 48.4 | 16.4 | 7.8 | $863 | 36.3 | 16.1 | 68.9 | 51.1 | 76.8 | 4.7 | 4.8 | 9.5 |
| Powellhurst-Gilbert | 25,104 | 8,128 | 36 | $36,982 | 47 | 44.7 | 11.4 | 6.1 | 2.5 | 35.4 | 10.7 | 3.2 | $891 | 29.0 | 12.5 | 57.5 | 56.5 | 83.1 | 1.9 | 1.4 | 3.3 |
| Reed | 4,037 | 11,349 | 31 | $40,856 | 37 | 23.3 | 9.8 | 3.8 | 1.8 | 61.2 | 23.5 | 15.9 | $966 | 16.8 | 12.2 | 89.1 | 38.5 | 61.9 | 7.0 | 3.2 | 10.2 |
| Richmond | 11,932 | 9,800 | 37 | $66,773 | 60 | 40.7 | 11.4 | 3.6 | 1.0 | 43.4 | 34.9 | 24.6 | $1,049 | 11.4 | 6.4 | 88.4 | 41.2 | 81.3 | 3.3 | 1.9 | 5.2 |
| Rose City Park | 9,504 | 8,402 | 40 | $70,018 | 65 | 45.1 | 14.1 | 3.1 | 0.7 | 37.0 | 32.7 | 22.9 | $1,098 | 8.8 | 7.7 | 89.2 | 45.5 | 85.2 | 1.2 | 1.2 | 2.5 |
| Roseway | 6,372 | 7,898 | 39 | $56,272 | 68 | 43.8 | 14.1 | 3.5 | 1.2 | 37.4 | 30.9 | 16.3 | $983 | 8.1 | 9.4 | 88.9 | 46.7 | 84.5 | 1.0 | 0.8 | 1.9 |
| Russell | 3,810 | 5,351 | 48 | $52,333 | 83 | 51.2 | 13.3 | 12.7 | 0.7 | 22.2 | 15.5 | 6.5 | $982 | 11.4 | 7.1 | 77.5 | 31.3 | 86.5 | 1.3 | 1.4 | 2.7 |
| Sabin | 4,495 | 9,767 | 37 | $81,579 | 67 | 41.5 | 11.5 | 2.4 | 1.6 | 43.1 | 37.0 | 29.5 | $1,278 | 13.3 | 7.5 | 93.2 | 49.8 | 80.8 | 1.3 | 1.2 | 2.5 |
| Sellwood-Moreland | 10,014 | 7,300 | 39 | $58,457 | 51 | 51.0 | 12.5 | 4.1 | 0.9 | 31.5 | 30.4 | 26.4 | $893 | 12.1 | 4.8 | 89.6 | 48.2 | 86.3 | 3.2 | 2.1 | 5.4 |
| South Burlingame | 1,732 | 5,138 | 40 | $78,149 | 79 | 53.2 | 10.7 | 4.6 | 0.1 | 31.5 | 37.5 | 25.9 | $1,274 | 11.9 | 12.4 | 91.2 | 39.1 | 81.8 | 6.5 | 3.5 | 9.9 |
| South Portland | 9,404 | 7,529 | 35 | $71,396 | 36 | 35.5 | 13.7 | 3.3 | 1.2 | 46.4 | 40.8 | 27.4 | $1,381 | 13.8 | 8.5 | 86.5 | 28.3 | 63.4 | 9.2 | 3.5 | 12.7 |
| South Tabor | 6,506 | 8,996 | 39 | $55,924 | 54 | 43.1 | 12.5 | 4.0 | 2.2 | 38.4 | 25.7 | 16.2 | $960 | 16.0 | 9.9 | 81.3 | 35.0 | 78.8 | 4.6 | 2.3 | 6.9 |
| Southwest Hills | 6,948 | 4,234 | 44 | $128,857 | 62 | 61.2 | 8.2 | 3.7 | 0.5 | 26.4 | 32.5 | 44.7 | $2,198 | 12.1 | 7.2 | 89.4 | 39.5 | 84.2 | 4.0 | 2.8 | 6.7 |
| St. Johns | 11,743 | 8,744 | 38 | $52,188 | 59 | 47.0 | 14.3 | 3.3 | 3.3 | 32.2 | 15.8 | 10.2 | $1,116 | 20.1 | 11.3 | 81.1 | 37.9 | 82.4 | 4.3 | 4.7 | 9.0 |
| Sullivan's Gulch | 2,902 | 10,143 | 37 | $47,714 | 30 | 35.9 | 11.9 | 2.7 | 1.7 | 47.8 | 34.7 | 22.4 | $946 | 12.2 | 7.9 | 90.3 | 40.1 | 74.5 | 2.2 | 1.8 | 4.0 |
| Sumner | 1,907 | 5,755 | 36 | $37,552 | 70 | 30.0 | 22.2 | 3.2 | 4.3 | 40.2 | 11.9 | 4.8 | $1,025 | 18.0 | 12.9 | 78.3 | 53.4 | 65.4 | 11.1 | 4.2 | 15.3 |
| Sunderland | 364 | 2,887 | 37 | $39,427 | 61 | 27.2 | 21.6 | 2.1 | 6.3 | 42.8 | 8.3 | 4.5 | $984 | 13.1 | 15.2 | 81.6 | 56.2 | 55.0 | 16.2 | 6.9 | 23.2 |
| Sunnyside | 7,568 | 12,785 | 35 | $55,329 | 44 | 32.9 | 10.5 | 3.4 | 0.4 | 52.8 | 37.1 | 24.3 | $971 | 13.7 | 7.2 | 88.0 | 42.0 | 76.1 | 3.8 | 2.1 | 5.9 |
| Sylvan-Highlands | 948 | 1,670 | 46 | $161,831 | 88 | 66.9 | 7.9 | 3.9 | 0.9 | 20.4 | 34.8 | 41.5 | $1,323 | 3.9 | 6.6 | 92.3 | 42.9 | 87.2 | 3.4 | 2.7 | 6.1 |
| University Park | 6,374 | 9,740 | 23 | $58,072 | 60 | 28.8 | 7.4 | 2.2 | 0.5 | 58.0 | 25.4 | 17.7 | $1,165 | 19.4 | 8.9 | 86.7 | 36.2 | 69.0 | 4.2 | 1.5 | 5.6 |
| Vernon | 2,614 | 9,445 | 35 | $69,867 | 65 | 38.8 | 11.1 | 2.3 | 1.8 | 45.9 | 37.9 | 22.1 | $1,147 | 15.3 | 7.6 | 89.9 | 44.1 | 78.1 | 1.5 | 1.2 | 2.7 |
| West Portland Park | 3,922 | 6,618 | 34 | $70,432 | 60 | 40.8 | 15.7 | 4.6 | 0.4 | 38.5 | 27.2 | 17.1 | $1,023 | 15.4 | 9.7 | 78.2 | 43.1 | 76.8 | 8.7 | 3.8 | 12.4 |
| Wilkes | 9,391 | 6,628 | 43 | $52,995 | 63 | 51.9 | 15.5 | 6.3 | 2.0 | 24.3 | 13.6 | 5.1 | $933 | 19.8 | 8.9 | 73.5 | 36.5 | 89.4 | 1.3 | 1.5 | 2.8 |
| Woodland Park | 308 | 6,554 | 38 | $49,278 | 51 | 41.7 | 13.0 | 6.6 | 0.0 | 38.8 | 17.0 | 6.5 | $1,045 | 14.7 | 5.5 | 76.9 | 44.3 | 78.4 | 2.1 | 1.8 | 3.9 |
| Woodlawn | 5,202 | 8,612 | 35 | $62,929 | 65 | 36.1 | 12.9 | 2.8 | 2.3 | 45.8 | 33.8 | 18.5 | $1,048 | 16.0 | 9.8 | 87.6 | 39.9 | 77.4 | 1.5 | 1.2 | 2.7 |
| Woodstock | 8,924 | 7,389 | 37 | $72,027 | 75 | 51.8 | 10.7 | 3.4 | 0.8 | 33.3 | 30.3 | 20.3 | $1,273 | 9.1 | 6.0 | 90.6 | 47.3 | 85.5 | 2.1 | 1.6 | 3.8 |
Crime
| Neighborhood | Aggravated assault | Arson | Burglary | Homicide | Larceny | Rape | Robbery | Vehicle thefts | Nonviolent crimes | Violent crimes | Crimes per 1,000 residents |
|---|---|---|---|---|---|---|---|---|---|---|---|
| Alameda | 1 | 0 | 15 | 0 | 20 | 1 | 1 | 7 | 82 | 3 | 16 |
| Arbor Lodge | 8 | 0 | 34 | 0 | 250 | 0 | 14 | 40 | 393 | 22 | 64 |
| Ardenwald/Johnson Creek | 0 | 0 | 2 | 1 | 4 | 0 | 0 | 0 | 12 | 1 | 10 |
| Argay | 19 | 1 | 44 | 0 | 128 | 2 | 12 | 56 | 317 | 34 | 55 |
| Arlington Heights | 1 | 0 | 8 | 0 | 4 | 0 | 1 | 5 | 118 | 2 | 111 |
| Arnold Creek | 0 | 0 | 3 | 0 | 3 | 0 | 0 | 1 | 16 | 0 | 5 |
| Ashcreek | 4 | 0 | 8 | 1 | 16 | 0 | 0 | 3 | 38 | 5 | 8 |
| Beaumont-Wilshire | 1 | 0 | 27 | 0 | 37 | 0 | 0 | 7 | 125 | 1 | 21 |
| Boise | 11 | 0 | 47 | 0 | 82 | 1 | 4 | 16 | 307 | 16 | 82 |
| Brentwood/Darlington | 30 | 4 | 69 | 0 | 152 | 5 | 12 | 68 | 381 | 51 | 33 |
| Bridgeton | 1 | 0 | 10 | 0 | 7 | 0 | 0 | 5 | 44 | 1 | 114 |
| Bridlemile | 2 | 0 | 8 | 0 | 16 | 0 | 1 | 5 | 36 | 3 | 8 |
| Brooklyn | 6 | 0 | 15 | 0 | 45 | 0 | 4 | 20 | 128 | 10 | 27 |
| Buckman | 46 | 13 | 66 | 0 | 300 | 4 | 19 | 79 | 983 | 82 | 134 |
| Cathedral Park | 8 | 1 | 30 | 0 | 77 | 1 | 1 | 5 | 136 | 11 | 38 |
| Centennial | 93 | 7 | 152 | 2 | 361 | 7 | 28 | 185 | 941 | 137 | 43 |
| Collins View | 1 | 1 | 7 | 0 | 31 | 0 | 0 | 2 | 45 | 2 | 18 |
| Concordia | 8 | 1 | 70 | 0 | 132 | 1 | 6 | 40 | 321 | 16 | 36 |
| Creston-Kenilworth | 12 | 7 | 55 | 0 | 143 | 0 | 7 | 52 | 380 | 26 | 49 |
| Crestwood | 0 | 0 | 3 | 0 | 2 | 0 | 1 | 2 | 11 | 1 | 10 |
| Cully | 47 | 2 | 76 | 2 | 191 | 9 | 25 | 52 | 436 | 85 | 37 |
| Downtown | 95 | 5 | 101 | 1 | 1,342 | 11 | 75 | 69 | 2208 | 187 | 221 |
| Dunthorpe | — | — | — | — | — | — | — | — | — | — | — |
| East Columbia | 13 | 2 | 24 | 0 | 238 | 0 | 13 | 27 | 361 | 28 | 181 |
| Eastmoreland | 0 | 1 | 38 | 0 | 40 | 1 | 0 | 12 | 144 | 2 | 30 |
| Eliot | 19 | 3 | 72 | 0 | 208 | 3 | 9 | 35 | 531 | 34 | 171 |
| Far Southwest | 1 | 0 | 3 | 0 | 42 | 1 | 0 | 2 | 59 | 2 | 32 |
| Forest Park | 1 | 0 | 9 | 0 | 13 | 0 | 0 | 1 | 73 | 1 | 27 |
| Foster-Powell | 18 | 1 | 94 | 0 | 170 | 2 | 8 | 56 | 424 | 29 | 60 |
| Glenfair | 18 | 0 | 29 | 0 | 43 | 3 | 14 | 34 | 151 | 35 | 61 |
| Goose Hollow | 14 | 4 | 54 | 0 | 146 | 1 | 9 | 17 | 395 | 28 | 83 |
| Grant Park | 5 | 1 | 32 | 0 | 72 | 1 | 0 | 9 | 150 | 7 | 42 |
| Hayden Island | 8 | 6 | 15 | 0 | 271 | 0 | 10 | 53 | 407 | 24 | 534 |
| Hayhurst | 4 | 0 | 16 | 0 | 41 | 1 | 0 | 7 | 96 | 5 | 17 |
| Hazelwood | 116 | 6 | 239 | 3 | 1,122 | 13 | 50 | 255 | 1976 | 188 | 88 |
| Healy Heights | 0 | 0 | 2 | 0 | 0 | 0 | 0 | 0 | 3 | 0 | 11 |
| Hillsdale | 1 | 1 | 12 | 1 | 54 | 1 | 0 | 8 | 105 | 4 | 13 |
| Hillside | 1 | 0 | 11 | 0 | 4 | 0 | 0 | 1 | 43 | 1 | 20 |
| Hollywood | 10 | 0 | 18 | 0 | 144 | 1 | 8 | 16 | 239 | 19 | 124 |
| Homestead | 3 | 1 | 10 | 0 | 64 | 3 | 1 | 7 | 118 | 8 | 63 |
| Hosford-Abernethy | 7 | 4 | 54 | 0 | 190 | 0 | 6 | 44 | 546 | 17 | 73 |
| Humboldt | 29 | 1 | 41 | 1 | 114 | 0 | 5 | 18 | 261 | 36 | 60 |
| Irvington | 10 | 0 | 44 | 0 | 115 | 3 | 3 | 42 | 292 | 16 | 53 |
| Kenton | 24 | 1 | 48 | 0 | 120 | 0 | 18 | 45 | 295 | 43 | 43 |
| Kerns | 9 | 3 | 49 | 0 | 121 | 2 | 6 | 45 | 409 | 20 | 72 |
| King | 19 | 1 | 47 | 0 | 139 | 1 | 12 | 26 | 268 | 33 | 45 |
| Laurelhurst | 3 | 0 | 35 | 0 | 29 | 0 | 2 | 5 | 129 | 5 | 29 |
| Lents | 73 | 4 | 169 | 2 | 637 | 7 | 41 | 191 | 1253 | 127 | 68 |
| Linnton | 1 | 0 | 3 | 0 | 8 | 3 | 0 | 0 | 48 | 4 | 125 |
| Lloyd District | 21 | 2 | 27 | 1 | 576 | 6 | 42 | 57 | 835 | 72 | 375 |
| Madison South | 21 | 1 | 48 | 0 | 89 | 2 | 11 | 46 | 230 | 35 | 34 |
| Maplewood | 0 | 0 | 4 | 0 | 15 | 0 | 1 | 0 | 23 | 1 | 9 |
| Markham | 1 | 0 | 7 | 0 | 5 | 0 | 0 | 0 | 24 | 1 | 12 |
| Marshall Park | 0 | 0 | 5 | 0 | 2 | 0 | 0 | 1 | 10 | 0 | 6 |
| Mill Park | 31 | 0 | 60 | 0 | 149 | 3 | 10 | 74 | 377 | 44 | 45 |
| Montavilla | 49 | 3 | 134 | 0 | 245 | 2 | 30 | 106 | 653 | 84 | 44 |
| Mt Scott-Arleta | 18 | 5 | 72 | 0 | 155 | 4 | 7 | 53 | 365 | 34 | 55 |
| Mt Tabor | 4 | 0 | 49 | 0 | 78 | 0 | 2 | 29 | 279 | 6 | 28 |
| Multnomah | 1 | 1 | 28 | 0 | 61 | 2 | 2 | 17 | 144 | 6 | 19 |
| North Tabor | 8 | 0 | 15 | 1 | 88 | 1 | 4 | 33 | 195 | 14 | 38 |
| Northwest District | 25 | 2 | 120 | 0 | 437 | 3 | 19 | 108 | 1224 | 49 | 85 |
| Northwest Heights | 0 | 0 | 2 | 0 | 4 | 0 | 0 | 2 | 13 | 0 | 9 |
| Old Town/Chinatown | 106 | 1 | 29 | 1 | 362 | 6 | 47 | 26 | 582 | 161 | 228 |
| Overlook | 16 | 1 | 64 | 0 | 131 | 5 | 12 | 29 | 348 | 34 | 58 |
| Parkrose | 52 | 0 | 57 | 1 | 135 | 4 | 6 | 83 | 442 | 63 | 83 |
| Parkrose Heights | 12 | 0 | 50 | 0 | 56 | 0 | 10 | 25 | 224 | 22 | 39 |
| Pearl District | 19 | 0 | 54 | 0 | 401 | 4 | 19 | 36 | 1020 | 42 | 180 |
| Piedmont | 14 | 0 | 44 | 0 | 70 | 2 | 3 | 20 | 189 | 19 | 30 |
| Pleasant Valley | 9 | 0 | 40 | 0 | 53 | 2 | 0 | 27 | 172 | 11 | 21 |
| Portsmouth | 37 | 7 | 55 | 3 | 86 | 6 | 13 | 46 | 247 | 66 | 30 |
| Powellhurst-Gilbert | 124 | 7 | 149 | 2 | 437 | 8 | 48 | 156 | 971 | 189 | 46 |
| Reed | 5 | 0 | 17 | 0 | 40 | 0 | 0 | 25 | 122 | 5 | 31 |
| Richmond | 12 | 2 | 53 | 1 | 189 | 3 | 7 | 61 | 682 | 25 | 59 |
| Rose City Park | 6 | 0 | 37 | 0 | 58 | 0 | 8 | 29 | 209 | 14 | 23 |
| Roseway | 14 | 1 | 33 | 1 | 61 | 0 | 3 | 27 | 158 | 19 | 28 |
| Russell | 3 | 1 | 32 | 0 | 149 | 1 | 2 | 15 | 244 | 7 | 66 |
| Sabin | 9 | 4 | 22 | 0 | 48 | 1 | 3 | 5 | 104 | 17 | 27 |
| Sellwood-Moreland | 5 | 2 | 53 | 0 | 164 | 2 | 2 | 60 | 427 | 11 | 44 |
| South Burlingame | 4 | 0 | 2 | 0 | 7 | 0 | 0 | 0 | 19 | 4 | 13 |
| South Portland | 4 | 3 | 32 | 0 | 81 | 1 | 4 | 23 | 293 | 12 | 32 |
| South Tabor | 9 | 0 | 56 | 0 | 91 | 2 | 2 | 24 | 241 | 13 | 39 |
| Southwest Hills | 2 | 1 | 22 | 0 | 21 | 0 | 0 | 5 | 87 | 3 | 13 |
| St. Johns | 51 | 6 | 103 | 0 | 302 | 5 | 18 | 42 | 559 | 80 | 54 |
| Sullivan's Gulch | 7 | 3 | 32 | 0 | 137 | 1 | 6 | 32 | 278 | 17 | 102 |
| Sumner | 14 | 1 | 20 | 0 | 42 | 1 | 4 | 14 | 93 | 20 | 59 |
| Sunderland | 2 | 0 | 8 | 0 | 18 | 1 | 1 | 7 | 72 | 4 | 209 |
| Sunnyside | 9 | 1 | 41 | 0 | 190 | 0 | 5 | 54 | 399 | 15 | 55 |
| Sylvan-Highlands | 1 | 0 | 4 | 0 | 9 | 0 | 2 | 3 | 29 | 3 | 34 |
| University Park | 9 | 3 | 38 | 0 | 80 | 0 | 7 | 26 | 208 | 19 | 36 |
| Vernon | 6 | 0 | 15 | 0 | 55 | 0 | 7 | 4 | 91 | 13 | 40 |
| West Portland Park | 6 | 1 | 12 | 0 | 17 | 0 | 1 | 6 | 47 | 8 | 14 |
| Wilkes | 15 | 2 | 51 | 0 | 73 | 4 | 7 | 47 | 267 | 28 | 31 |
| Woodland Park | 0 | 0 | 2 | 0 | 5 | 1 | 1 | 1 | 10 | 2 | 39 |
| Woodlawn | 17 | 0 | 33 | 0 | 57 | 1 | 8 | 9 | 152 | 26 | 34 |
| Woodstock | 11 | 1 | 82 | 2 | 126 | 1 | 11 | 30 | 322 | 26 | 39 |
Lifestyle
| Neighborhood | Parks (% of city) | Parks and Natural Areas (Acres) | Minutes By Car to Downtown (est) | % Commute by public transit | % Commute by bike | % Commute by walking | % Commute by biking and walking | Number of Max/streetcar lines | Number of bus lines | Number of transit lines (bus/MAX/streetcar) | Miles of bike routes (lanes, boulevards, multiuse paths) | Miles of bike routes (all) per square mile | Walk Score |
|---|---|---|---|---|---|---|---|---|---|---|---|---|---|
| Alameda | 0 | 0 | 14 | 7.1 | 14.1 | 2.5 | 16.6 | 0 | 3 | 3 | 0.7 | 1.2 | 60 |
| Arbor Lodge | 2 | 10 | 13 | 13.4 | 12.8 | 2.7 | 15.5 | 1 | 4 | 5 | 5.7 | 6.6 | 72 |
| Ardenwald/Johnson Creek | 6 | 37 | 14 | 5.9 | 5.2 | 3.3 | 8.5 | 1 | 7 | 8 | 3.1 | 3.0 | 54 |
| Argay | 5 | 59 | 18 | 8.6 | 2.8 | 13.6 | 16.3 | 0 | 5 | 5 | 5.9 | 2.9 | 45 |
| Arlington Heights | 63 | 329 | 12 | 6.6 | 6.0 | 5.9 | 11.9 | 2 | 5 | 7 | 1.3 | 1.6 | 27 |
| Arnold Creek | 3 | 19 | 15 | 3.1 | 1.6 | 1.8 | 3.4 | 0 | 1 | 1 | 0.2 | 0.2 | 16 |
| Ashcreek | 1 | 11 | 18 | 8.3 | 2.5 | 1.1 | 3.6 | 0 | 8 | 8 | 2.0 | 1.6 | 35 |
| Beaumont-Wilshire | 3 | 14 | 15 | 5.9 | 7.8 | 3.6 | 11.4 | 0 | 3 | 3 | 4.2 | 5.6 | 75 |
| Boise | 2 | 5 | 11 | 13.2 | 18.4 | 5.1 | 23.5 | 1 | 6 | 7 | 2.0 | 4.7 | 88 |
| Brentwood/Darlington | 4 | 48 | 19 | 12.4 | 4.0 | 0.2 | 4.2 | 0 | 4 | 4 | 6.1 | 3.5 | 55 |
| Bridgeton | 1 | 1 | 20 | 11.1 | 2.9 | 0.7 | 3.6 | 0 | 2 | 2 | 2.9 | 10.7 | 29 |
| Bridlemile | 4 | 33 | 15 | 6.2 | 1.9 | 3.9 | 5.8 | 0 | 6 | 6 | 2.2 | 1.6 | 38 |
| Brooklyn | 6 | 67 | 11 | 13.7 | 13.9 | 4.0 | 17.9 | 1 | 10 | 11 | 3.4 | 2.0 | 78 |
| Buckman | 2 | 14 | 9 | 18.1 | 15.1 | 16.3 | 31.4 | 1 | 12 | 13 | 9.2 | 8.0 | 88 |
| Cathedral Park | 10 | 64 | 18 | 10.4 | 1.9 | 4.1 | 6.0 | 0 | 4 | 4 | 2.0 | 1.9 | 76 |
| Centennial | 4 | 80 | 25 | 8.8 | 0.7 | 1.7 | 2.5 | 0 | 3 | 3 | 7.3 | 2.2 | 49 |
| Collins View | 0 | 0 | 13 | 5.2 | 2.1 | 15.6 | 17.7 | 0 | 4 | 4 | 1.6 | 1.8 | 20 |
| Concordia | 3 | 27 | 19 | 7.1 | 8.6 | 2.7 | 11.3 | 0 | 4 | 4 | 4.3 | 3.2 | 74 |
| Creston-Kenilworth | 4 | 23 | 15 | 19.5 | 6.4 | 4.5 | 10.8 | 0 | 7 | 7 | 4.0 | 5.0 | 75 |
| Crestwood | 25 | 55 | 16 | 8.4 | 2.7 | 0.9 | 3.7 | 0 | 5 | 5 | 0.0 | 0.0 | 49 |
| Cully | 3 | 56 | 16 | 10.6 | 5.5 | 9.4 | 14.9 | 0 | 4 | 4 | 6.8 | 2.2 | 55 |
| Downtown | 7 | 42 | 0 | 22.5 | 3.9 | 33.6 | 37.5 | 7 | 34 | 41 | 13.5 | 14.3 | 95 |
| Dunthorpe | 0 | 0 | 18 | 5.2 | 2.1 | 15.6 | 17.7 | 1 | 2 | 3 | 0.4 | 0.3 | 10 |
| East Columbia | 9 | 129 | 18 | 11.1 | 2.9 | 0.8 | 3.8 | 0 | 2 | 2 | 6.4 | 2.8 | 21 |
| Eastmoreland | 2 | 17 | 12 | 8.6 | 6.8 | 8.4 | 15.3 | 1 | 6 | 7 | 2.5 | 2.3 | 50 |
| Eliot | 1 | 8 | 9 | 18.0 | 12.1 | 13.0 | 25.1 | 2 | 9 | 11 | 5.9 | 7.0 | 83 |
| Far Southwest | 3 | 12 | 15 | 3.8 | 0.4 | 1.0 | 1.4 | 0 | 6 | 6 | 1.8 | 3.1 | 39 |
| Forest Park | 41 | 4,828 | 12 | 2.4 | 2.2 | 1.0 | 3.2 | 0 | 4 | 4 | 18.9 | 1.0 | 8 |
| Foster-Powell | 1 | 7 | 18 | 9.7 | 8.7 | 2.4 | 11.1 | 0 | 6 | 6 | 1.7 | 1.9 | 79 |
| Glenfair | 2 | 5 | 21 | 14.8 | 0.3 | 4.8 | 5.1 | 1 | 2 | 3 | 1.1 | 3.6 | 49 |
| Goose Hollow | 1 | 3 | 5 | 17.2 | 5.7 | 21.8 | 27.5 | 2 | 11 | 13 | 1.3 | 3.9 | 92 |
| Grant Park | 7 | 20 | 13 | 8.0 | 10.7 | 4.6 | 15.2 | 0 | 3 | 3 | 2.2 | 4.8 | 81 |
| Hayden Island | 0 | 2 | 23 | 6.4 | 1.1 | 6.1 | 7.2 | 0 | 1 | 1 | 1.6 | 0.5 | 29 |
| Hayhurst | 8 | 57 | 17 | 8.6 | 2.0 | 0.6 | 2.6 | 0 | 7 | 7 | 3.8 | 3.3 | 43 |
| Hazelwood | 2 | 45 | 17 | 13.4 | 0.4 | 2.6 | 3.0 | 3 | 11 | 14 | 14.7 | 3.6 | 58 |
| Healy Heights | 3 | 1 | 13 | 4.6 | 4.1 | 18.8 | 22.9 | 0 | 1 | 1 | 0.0 | 0.0 | 8 |
| Hillsdale | 6 | 69 | 11 | 10.2 | 2.2 | 6.4 | 8.6 | 0 | 16 | 16 | 8.6 | 4.6 | 52 |
| Hillside | 29 | 127 | 12 | 5.5 | 4.4 | 4.2 | 8.6 | 0 | 2 | 2 | 0.9 | 1.3 | 45 |
| Hollywood | 0 | 0 | 10 | 13.6 | 9.4 | 5.5 | 14.9 | 3 | 4 | 7 | 2.0 | 8.6 | 91 |
| Homestead | 47 | 246 | 11 | 5.4 | 3.6 | 18.3 | 21.9 | 1 | 16 | 17 | 3.7 | 4.5 | 44 |
| Hosford-Abernethy | 0 | 3 | 10 | 15.8 | 14.9 | 10.0 | 24.9 | 2 | 16 | 18 | 8.5 | 6.5 | 89 |
| Humboldt | 0 | 0 | 12 | 7.6 | 19.7 | 3.3 | 23.0 | 0 | 3 | 3 | 3.8 | 6.9 | 83 |
| Irvington | 4 | 16 | 11 | 10.7 | 10.8 | 7.3 | 18.1 | 0 | 5 | 5 | 3.2 | 4.9 | 83 |
| Kenton | 5 | 120 | 21 | 11.1 | 3.7 | 1.5 | 5.2 | 1 | 5 | 6 | 12.5 | 3.6 | 68 |
| Kerns | 3 | 18 | 12 | 20.8 | 13.0 | 10.4 | 23.4 | 5 | 12 | 17 | 4.0 | 4.9 | 87 |
| King | 1 | 3 | 14 | 10.9 | 16.8 | 2.4 | 19.2 | 0 | 3 | 3 | 0.9 | 1.4 | 85 |
| Laurelhurst | 8 | 34 | 9 | 7.6 | 9.0 | 4.2 | 13.1 | 3 | 6 | 9 | 4.1 | 6.1 | 79 |
| Lents | 9 | 215 | 17 | 8.8 | 1.8 | 3.5 | 5.3 | 1 | 7 | 8 | 18.8 | 5.1 | 49 |
| Linnton | 3 | 40 | 16 | 1.4 | 2.9 | 0.7 | 3.7 | 0 | 1 | 1 | 5.0 | 2.3 | 6 |
| Lloyd District | 1 | 2 | 10 | 19.5 | 11.8 | 17.4 | 29.2 | 5 | 11 | 16 | 6.9 | 13.5 | 86 |
| Madison South | 10 | 107 | 15 | 12.7 | 3.5 | 1.6 | 5.1 | 3 | 6 | 9 | 3.5 | 2.0 | 54 |
| Maplewood | 3 | 10 | 17 | 6.2 | 2.1 | 1.6 | 3.7 | 0 | 1 | 1 | 3.8 | 6.1 | 29 |
| Markham | 3 | 9 | 12 | 4.7 | 4.2 | 2.0 | 6.2 | 0 | 4 | 4 | 0.1 | 0.2 | 38 |
| Marshall Park | 16 | 64 | 13 | 3.8 | 1.8 | 6.2 | 8.0 | 0 | 4 | 4 | 0.0 | 0.0 | 20 |
| Mill Park | 2 | 15 | 20 | 16.1 | 1.5 | 4.9 | 6.4 | 0 | 3 | 3 | 2.9 | 2.9 | 68 |
| Montavilla | 1 | 20 | 14 | 12.9 | 4.8 | 3.2 | 8.0 | 3 | 6 | 9 | 8.2 | 3.8 | 70 |
| Mt Scott-Arleta | 2 | 11 | 19 | 10.3 | 5.9 | 1.0 | 6.9 | 0 | 5 | 5 | 2.4 | 2.8 | 75 |
| Mt Tabor | 17 | 178 | 14 | 9.5 | 9.0 | 2.4 | 11.4 | 0 | 5 | 5 | 7.0 | 4.4 | 64 |
| Multnomah | 11 | 104 | 10 | 12.0 | 0.9 | 3.7 | 4.6 | 0 | 10 | 10 | 7.4 | 5.1 | 63 |
| North Tabor | 1 | 2 | 11 | 16.8 | 9.6 | 3.3 | 12.9 | 3 | 4 | 7 | 2.0 | 3.5 | 73 |
| Northwest District | 2 | 17 | 10 | 16.9 | 5.8 | 16.8 | 22.6 | 1 | 7 | 8 | 9.8 | 6.7 | 92 |
| Northwest Heights | 0 | 3 | 19 | 3.2 | 1.3 | 1.3 | 2.6 | 0 | 0 | 0 | 5.1 | 1.7 | 15 |
| Old Town/Chinatown | 7 | 12 | 3 | 19.7 | 5.8 | 25.6 | 31.3 | 5 | 22 | 27 | 3.9 | 13.8 | 95 |
| Overlook | 4 | 78 | 12 | 11.1 | 12.3 | 4.7 | 17.0 | 1 | 4.00 | 5 | 8.9 | 2.8 | 69 |
| Parkrose | 0 | 3 | 17 | 9.2 | 3.3 | 12.4 | 15.7 | 1 | 5 | 6 | 7.6 | 3.8 | 54 |
| Parkrose Heights | 2 | 14 | 14 | 13.1 | 0.9 | 2.1 | 2.9 | 0 | 6 | 6 | 3.1 | 3.2 | 52 |
| Pearl District | 3 | 9 | 8 | 15.1 | 5.1 | 22.8 | 27.9 | 2 | 7 | 9 | 4.3 | 9.7 | 99 |
| Piedmont | 5 | 30 | 19 | 13.0 | 8.6 | 1.8 | 10.4 | 0 | 4 | 4 | 5.3 | 5.5 | 67 |
| Pleasant Valley | 26 | 1,057 | 25 | 3.5 | 0.2 | 0.3 | 0.5 | 0 | 2 | 2 | 6.1 | 1.0 | 19 |
| Portsmouth | 9 | 65 | 18 | 14.6 | 5.1 | 2.4 | 7.5 | 0 | 3 | 3 | 8.3 | 7.6 | 51 |
| Powellhurst-Gilbert | 6 | 131 | 23 | 11.3 | 0.5 | 2.3 | 2.8 | 1 | 6 | 7 | 14.9 | 4.4 | 50 |
| Reed | 0 | 0 | 15 | 13.6 | 2.1 | 22.0 | 24.2 | 0 | 3 | 3 | 0.9 | 1.9 | 62 |
| Richmond | 1 | 4 | 14 | 13.7 | 12.7 | 3.5 | 16.3 | 0 | 6 | 6 | 4.2 | 3.3 | 85 |
| Rose City Park | 3 | 25 | 13 | 11.8 | 5.4 | 1.9 | 7.3 | 3 | 4 | 7 | 5.2 | 4.4 | 72 |
| Roseway | 1 | 4 | 15 | 12.6 | 5.8 | 0.7 | 6.6 | 0 | 4 | 4 | 1.6 | 1.9 | 74 |
| Russell | 3 | 15 | 12 | 5.2 | 3.5 | 2.2 | 5.7 | 0 | 3 | 3 | 4.2 | 5.3 | 33 |
| Sabin | 1 | 2 | 15 | 10.8 | 14.4 | 2.6 | 17.0 | 0 | 2 | 2 | 1.3 | 2.7 | 80 |
| Sellwood-Moreland | 23 | 312 | 15 | 8.1 | 10.9 | 2.0 | 12.9 | 0 | 7 | 7 | 8.3 | 4.0 | 77 |
| South Burlingame | 5 | 13 | 10 | 6.9 | 7.4 | 2.4 | 9.7 | 0 | 8 | 8 | 2.0 | 4.6 | 52 |
| South Portland | 6 | 70 | 10 | 15.9 | 3.9 | 12.1 | 15.9 | 3 | 25 | 28 | 9.4 | 5.5 | 55 |
| South Tabor | 2 | 12 | 16 | 10.3 | 5.2 | 2.5 | 7.7 | 0 | 4 | 4 | 3.7 | 4.6 | 65 |
| Southwest Hills | 11 | 168 | 9 | 3.0 | 2.2 | 9.9 | 12.1 | 2 | 5 | 7 | 1.5 | 0.6 | 31 |
| St. Johns | 31 | 2,180 | 19 | 10.2 | 2.4 | 1.5 | 3.8 | 0 | 5 | 5 | 19.0 | 1.7 | 59 |
| Sullivan's Gulch | 2 | 5 | 12 | 13.3 | 10.4 | 11.1 | 21.5 | 3 | 4 | 7 | 2.8 | 8.7 | 85 |
| Sumner | 3 | 16 | 16 | 10.0 | 3.2 | 11.6 | 14.8 | 1 | 3 | 4 | 2.2 | 2.8 | 63 |
| Sunderland | 5 | 57 | 18 | 10.0 | 4.4 | 16.0 | 20.4 | 0 | 3 | 3 | 3.2 | 1.7 | 16 |
| Sunnyside | 0 | 2 | 12 | 15.1 | 17.5 | 4.1 | 21.6 | 0 | 4 | 4 | 2.1 | 3.4 | 91 |
| Sylvan-Highlands | 12 | 70 | 11 | 0.7 | 0.9 | 2.5 | 3.4 | 2 | 4 | 6 | 1.7 | 1.8 | 17 |
| University Park | 3 | 26 | 17 | 5.1 | 6.3 | 20.3 | 26.6 | 0 | 3 | 3 | 4.4 | 3.4 | 43 |
| Vernon | 9 | 17 | 16 | 9.9 | 13.2 | 2.5 | 15.8 | 0 | 2 | 2 | 0.5 | 1.7 | 85 |
| West Portland Park | 8 | 39 | 14 | 14.8 | 0.0 | 2.0 | 2.0 | 0 | 6 | 6 | 1.9 | 2.6 | 59 |
| Wilkes | 10 | 199 | 21 | 4.6 | 0.7 | 2.2 | 2.9 | 0 | 5 | 5 | 11.0 | 3.6 | 29 |
| Woodland Park | 0 | 0 | 13 | 17.0 | 0.0 | 0.1 | 0.1 | 0 | 4 | 4 | 0.1 | 2.8 | 64 |
| Woodlawn | 2 | 8 | 14 | 7.2 | 12.6 | 2.6 | 15.2 | 0 | 3 | 3 | 3.1 | 4.2 | 69 |
| Woodstock | 2 | 14 | 19 | 8.5 | 6.4 | 3.6 | 9.9 | 0 | 5 | 5 | 3.7 | 3.0 | 67 |
Methodology
Neighborhoods
Portland neighborhood boundaries represent records maintained by the city as of January 2016. Neighborhood boundary conflicts were resolved for statistical purposes only. Due to overlap between certain neighborhoods, boundary definitions may vary occasionally across categories. With the exception of the area unofficially (but universally) known as Dunthorpe—new to our data set this year—unclaimed sections of Multnomah County were excluded.
Real Estate
2015 data from the Regional Multiple Listing Service with analysis by the Center for Spatial Analysis and Research at Portland State University’s Department of Geography. All figures were rounded for legibility.
People
Data from the US Census Bureau’s American Community Survey 5-Year Estimates, released December 2015. The ACS data are estimates only and accuracy varies by attribute.
Median Rent
Calculated from all renter-occupied units, estimated median rent is not adjusted for unit size or number of occupants. Figure includes estimated monthly utility costs.
Median Income
The ACS defines household as “all the persons who occupy a housing unit as their usual place of residence.” Thus this estimate includes living situations ranging from individuals to large households.
Population Density
Calculations exclude parks and industrial tracts.
Crime
Portland 2014 data is from the Portland Police Bureau. (Due to a PPB database overhaul, 2015 data was not available at press time.) Suburban data is from 2014 FBI records.
- Nonviolent crime includes burglary, larceny (theft), and vehicle theft.
- Violent crime is defined as aggravated assault, arson, homicide, rape, and robbery.
- Crimes per 1,000 figures are based on reported incidents of both nonviolent and violent crime. Many factors can influence the crimes-per-1,000 figure and can sometimes complicate meaningful neighborhood comparisons. Because the rates are based on residential population data, for instance, large nonresident workforces in areas like Lloyd District and Hayden Island can distort associated crime rates.
Parks
Data from Metro (2015 or most recently available) and city parks departments.
Transit
Portland 2015 data from TriMet. Suburban transit information was sourced from TriMet as well as individual cities and may contain varying standards of classification.
Minutes by Car to Downtown
Google Maps estimate, based on non–rush hour conditions, from a central neighborhood/suburb to Pioneer Courthouse Square.
Walk Score
2015 data from Walkscore.com. This score reflects, on a scale of 1 to 100, how easy it is to live in a neighborhood without a car or bike, based on the number of nearby amenities like sidewalks and grocery stores.
Unavailable Data
Unavailable data is noted with a dash (—).
Special thanks to David Banis, Sachi Arakawa, and Kyle Pangman of PSU’s Center for Spatial Analysis and Research. Additional research assistance from Caitlin Collins, Sarah Hopwood, Alex Keith, Sylvia Randall-Muñoz, and Jack Rushall.