Portland Neighborhoods by the Numbers 2018: The Suburbs
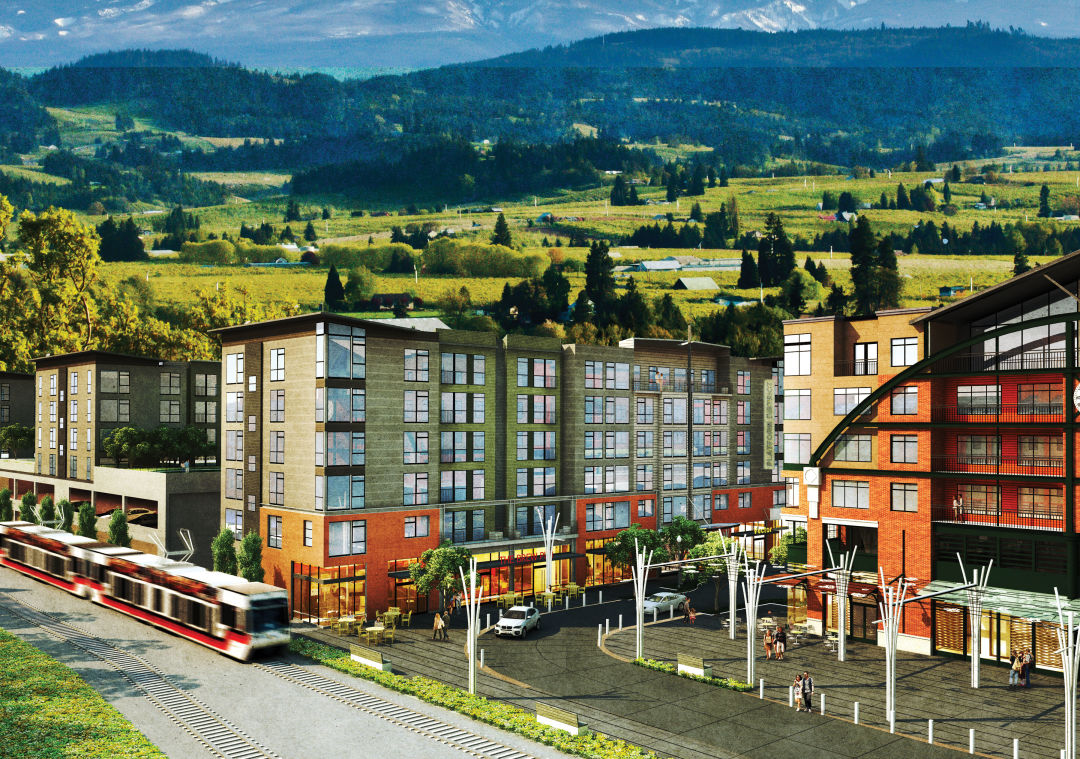
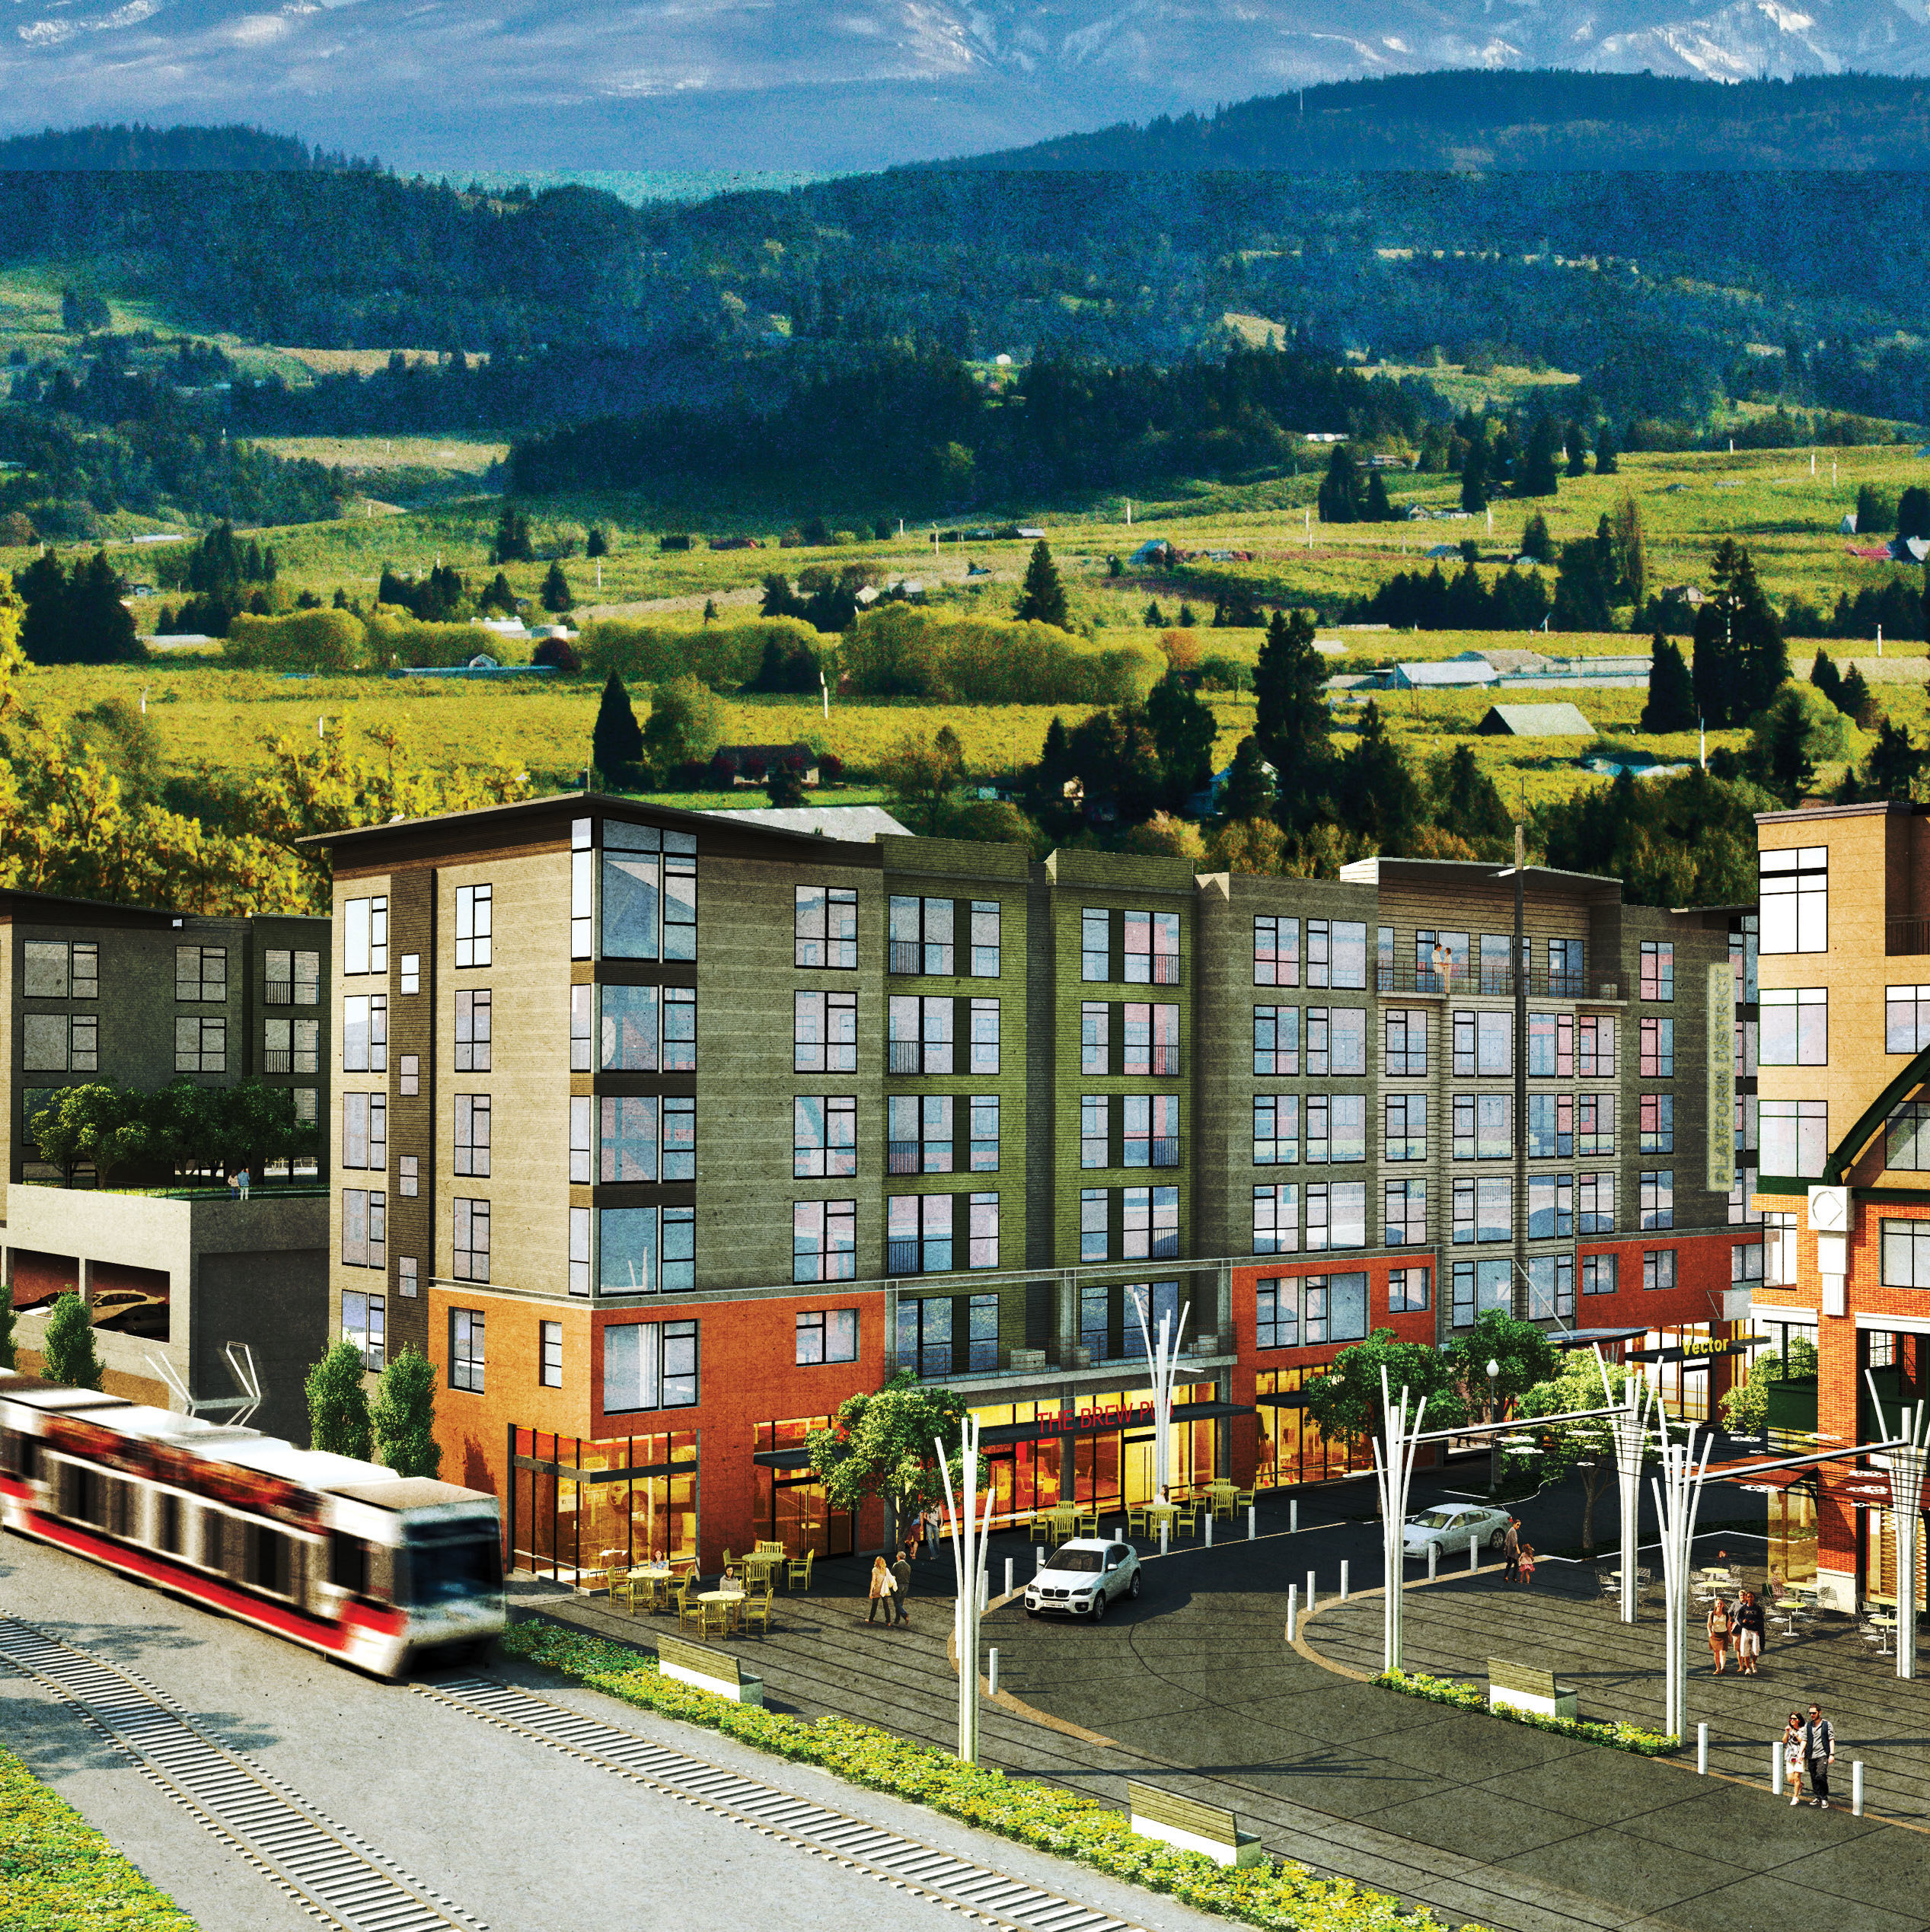
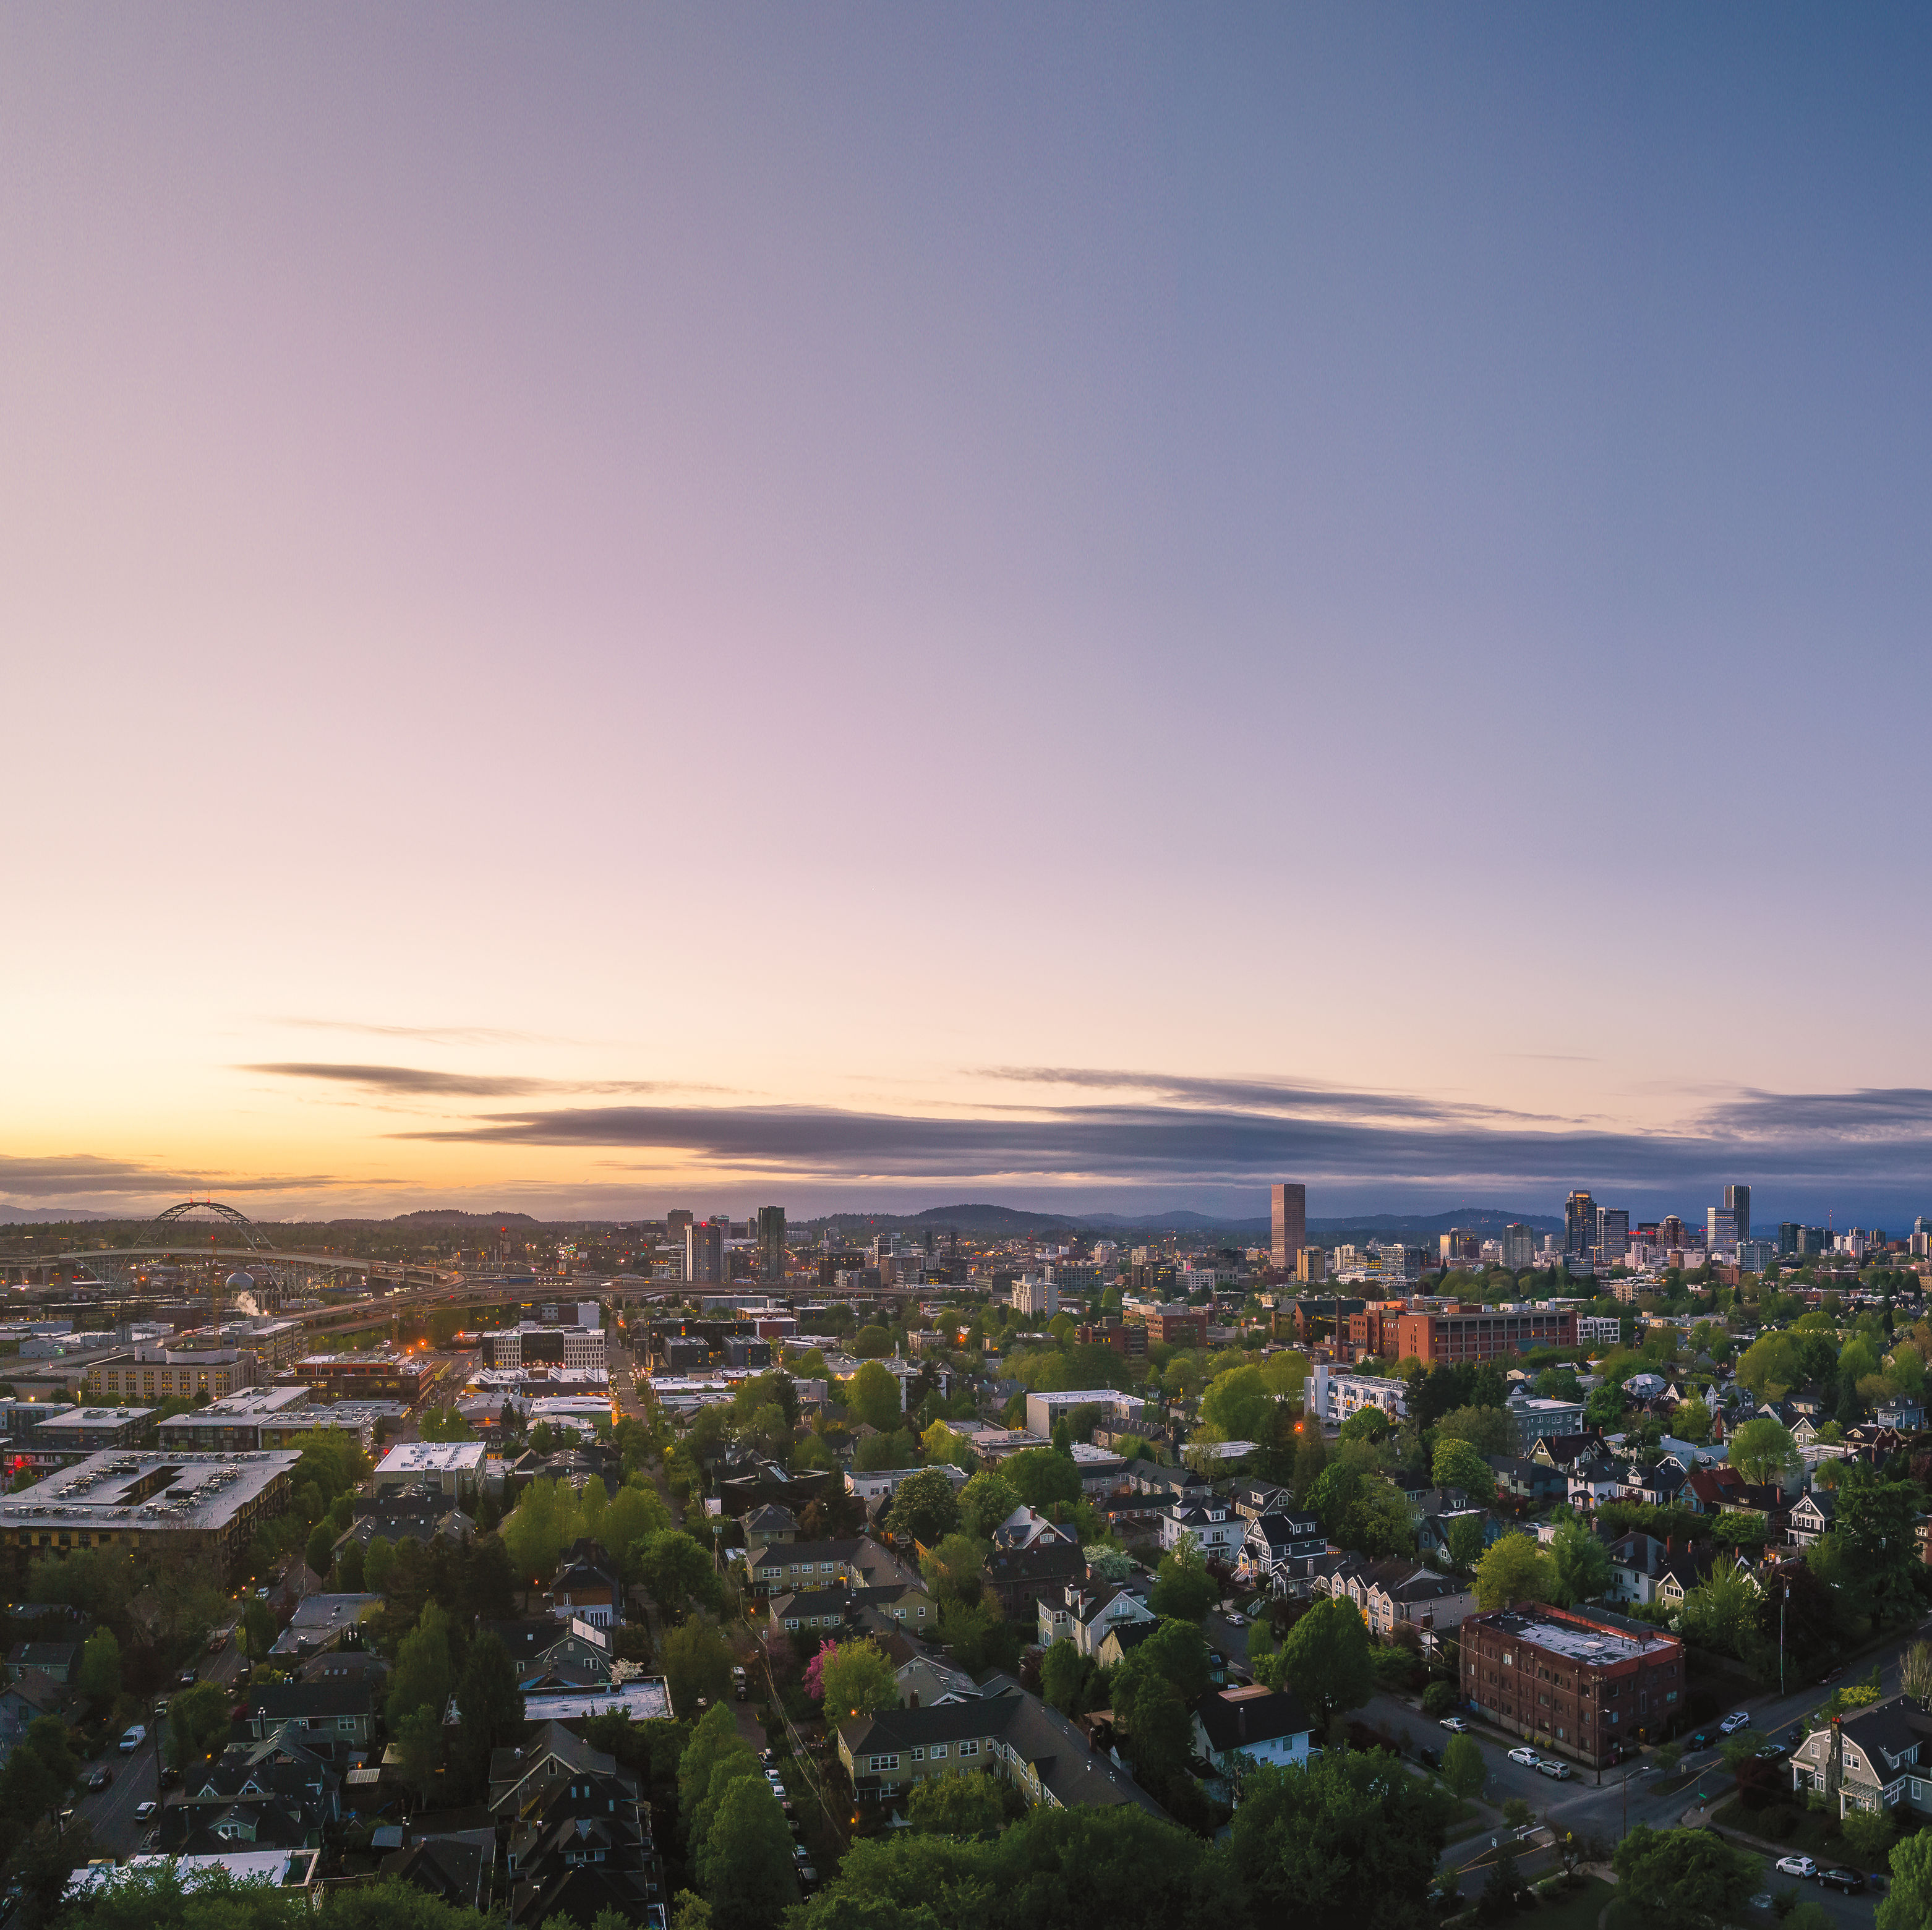
Hillsboro's Orenco Station neighborhood
Image: Bridget Calip and brink communications
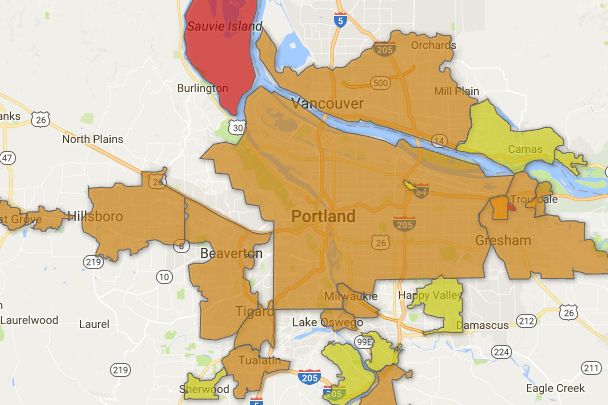
Welcome to our annual reference guide to 125 Portland neighborhoods and suburbs. Last year, two-thirds of Portland metro area markets clocked double-digit one-year median price changes. That hotness still holds in 2018. (Even as the fever breaks, just a bit, in the city of Portland, where prices rose just a median five percent.) From Cornelius to Wood Village, Beaverton to Scappoose, we crunch the numbers on 30 cities.
| City | Average home sale price ($) | Median home sale price ($) | Average cost per square foot ($) | Days on market (avg.) | Homes sold in 2017 (#) | Condo sales (%) | 1-year median price change (2016–2017) (%) | 5-year median price change (2013–2017) (%) | Distressed property sales (%) | Year built (avg.) | Adjusted population | Adjusted population density (people per sq. mi., excluding parks and industrial tracts) | Median age | Median household income ($) | Home ownership (%) | Married (except separated) (%) | Divorced (%) | Widowed (%) | Separated (%) | Never Married (%) | Population with bachelor’s degree as highest level of education (25 and older) (%) | Population with graduate degree (25 and older) (%) | Renters' median monthly housing expenses ($) | People below federal poverty level (%) | Unemployed (16 years and older) (%) | English as only language (%) | Percent of households with children under 18 years (%) | Population in same house last year (%) | Population in different Oregon county last year (%) | Population in different state last year (%) | Population who moved from abroad last year (%) | Total newcomers (%) | Aggravated assault | Arson | Burglary | Homicide | Larceny | Rape | Robbery | Vehicle thefts | Nonviolent crimes | Violent crimes | Crimes per 1,000 residents | Parks and natural areas (Acres) | Parks (% of city) | Minutes by car to downtown Portland (est) | Commute by public transit (%) | Commute by bike (%) | Commute by walking (%) | Commute by biking and walking (%) | Number of Max/streetcar lines | Number of bus lines | Number of transit lines (TriMet, C-TRAN, CC Rider, CAT, SMART, YCTA) | Miles of bike routes (lanes, boulevards, multiuse paths) | Miles of bike routes (all) per square mile | Walk score |
|---|---|---|---|---|---|---|---|---|---|---|---|---|---|---|---|---|---|---|---|---|---|---|---|---|---|---|---|---|---|---|---|---|---|---|---|---|---|---|---|---|---|---|---|---|---|---|---|---|---|---|---|---|---|---|---|---|
| Beaverton | 366,038 | 362,500 | 209 | 24 | 1,397 | 25 | 11 | 40 | 2 | 1987 | 94,865 | 4,833 | 36 | 59,620 | 47.6 | 47.8 | 12.5 | 4.4 | 2.4 | 32.9 | 29.7 | 15.1 | 1,094 | 13.4 | 7.9 | 72.6 | 29 | 79.9 | 4.1 | 4.3 | 1.4 | 9.8 | 78 | 22 | 124 | 0 | 1,176 | 25 | 30 | 103 | 1,403 | 155 | 16 | 1,277 | 0.1 | 14 | 10 | 1.1 | 3.4 | 4.5 | 3 | 21 | 24 | 97 | 4.9 | 48 |
| Camas | 502,391 | 462,200 | 192 | 51 | 567 | 2 | 16 | 46 | 1 | 1996 | 21,393 | 1,383 | 39 | 94,350 | 73.9 | 58.4 | 10.6 | 3.9 | 1.3 | 25.7 | 26.7 | 17.3 | 1,100 | 3.4 | 5.4 | 89.8 | 46.3 | 88.4 | 0.5 | 4.4 | 0.2 | 5.1 | 6 | 2 | 67 | 0 | 219 | 7 | 2 | 23 | 309 | 17 | 15 | 1,083 | 12.5 | 26 | 2.5 | 0.9 | 1.8 | 2.7 | 0 | 1 | 1 | 29 | 15.9 | 18 |
| Canby | 353,609 | 346,900 | 184 | 33 | 288 | 2 | 7 | 51 | 4 | 1982 | 17,218 | 3,940 | 36 | 62,035 | 67 | 55.2 | 12 | 5.4 | 2.1 | 25.3 | 17.7 | 9.2 | 935 | 11.3 | 5.4 | 79.9 | 38 | 87.2 | 3.4 | 1.4 | 0.7 | 5.5 | 14 | 0 | 31 | 0 | 138 | 6 | 1 | 10 | 179 | 21 | 12 | 133 | 4.6 | 30 | 1.6 | 0.5 | 2 | 2.5 | 0 | 1 | 1 | 13 | 2.9 | 85 |
| Cornelius | 307,729 | 305,500 | 184 | 25 | 158 | 0 | 17 | 74 | 4 | 1962 | 12,241 | 5,465 | 30 | 58,420 | 76 | 47.8 | 8.1 | 4 | 2.6 | 37.5 | 9.2 | 4 | 867 | 9.9 | 11.5 | 50.3 | 53.2 | 83.7 | 1 | 1.8 | 0.4 | 3.2 | 25 | 3 | 25 | 0 | 200 | 7 | 3 | 19 | 244 | 38 | 23 | 42 | 2.9 | 35 | 5 | 0.2 | 0.9 | 1.1 | 0 | 1 | 1 | 5 | 2.2 | 77 |
| Estacada | 317,877 | 329,950 | 170 | 50 | 124 | 0 | 16 | 74 | 3 | 1998 | 3,051 | 1,356 | 33 | 50,757 | 59.2 | 50.2 | 15.7 | 7.3 | 2.9 | 23.8 | 6.1 | 4.5 | 648 | 17.2 | 5.2 | 92.5 | 36.4 | 82.7 | 2.8 | 1.3 | 0 | 4.1 | 2 | 1 | 14 | 0 | 65 | 3 | 1 | 4 | 83 | 7 | 29 | 32 | 2.2 | 45 | 2.3 | 0 | 6.2 | 6.2 | 0 | 1 | 1 | 2 | 1 | 68 |
| Fairview | 293,228 | 284,950 | 175 | 31 | 116 | 4 | 5 | 45 | 7 | 1991 | 9,215 | 2,610 | 37 | 54,802 | 54.1 | 47.8 | 14 | 4.4 | 2.5 | 31.3 | 14.7 | 6.8 | 1,033 | 14.9 | 7.3 | 88.3 | 33.8 | 87.6 | 1.4 | 4.4 | 0 | 5.8 | 12 | 3 | 22 | 0 | 190 | 5 | 3 | 77 | 289 | 23 | 34 | 367 | 16.2 | 18 | 8.5 | 0 | 1.5 | 1.5 | 0 | 2 | 2 | 15 | 4.1 | 76 |
| Forest Grove | 348,542 | 329,700 | 183 | 35 | 384 | 3 | 16 | 46 | 2 | 1967 | 23,214 | 3,882 | 33 | 49,857 | 59.9 | 47.1 | 11 | 5.7 | 1.9 | 34.1 | 14.7 | 8.5 | 842 | 15.4 | 7.6 | 77.7 | 39 | 77.2 | 2.8 | 4.4 | 0.8 | 8 | 26 | 9 | 87 | 0 | 398 | 19 | 4 | 35 | 520 | 58 | 25 | 317 | 8.3 | 40 | 3.1 | 1 | 5 | 6 | 0 | 1 | 1 | 17 | 2.8 | 41 |
| Gladstone | 338,813 | 332,500 | 183 | 36 | 167 | 1 | 8 | 54 | 5 | 1963 | 11,850 | 4,759 | 40 | 57,169 | 59.9 | 44.6 | 17 | 6.6 | 1.3 | 30.5 | 15.8 | 5.4 | 1,053 | 12.7 | 8.8 | 89.3 | 34.6 | 82.6 | 4.4 | 1.9 | 0.6 | 6.9 | 6 | 8 | 36 | 1 | 229 | 9 | 1 | 43 | 308 | 25 | 28 | 159 | 10 | 22 | 3.6 | 0 | 1.8 | 1.8 | 0 | 5 | 5 | 7 | 2.8 | 54 |
| Gresham | 310,582 | 308,000 | 174 | 34 | 1,399 | 10 | 12 | 56 | 5 | 1982 | 110,042 | 4,675 | 35 | 49,866 | 52.5 | 45.5 | 12.3 | 5.7 | 2.6 | 34.1 | 13.7 | 6.1 | 958 | 20.4 | 8.8 | 73.9 | 36.9 | 84.3 | 2.9 | 2.7 | 0.5 | 6.1 | 235 | 20 | 415 | 5 | 1,837 | 71 | 113 | 813 | 3,065 | 444 | 32 | 1,743 | 11.6 | 24 | 7.9 | 0.7 | 2.6 | 3.3 | 1 | 12 | 13 | 144 | 6.1 | 43 |
| Happy Valley | 504,364 | 469,995 | 180 | 47 | 544 | 1 | 11 | 27 | 2 | 2003 | 17,474 | 1,781 | 39 | 106,197 | 84.7 | 62.1 | 8.3 | 3.6 | 1.5 | 24.6 | 32.3 | 20.3 | 1,282 | 4.4 | 6.5 | 76.1 | 43.8 | 87.6 | 3.3 | 3.6 | 0.6 | 7.5 | 6 | 0 | 81 | 0 | 221 | 5 | 1 | 29 | 331 | 12 | 20 | 609 | 8.7 | 20 | 2.1 | 0.4 | 0.4 | 0.8 | 0 | 3 | 3 | 28 | 2.6 | 54 |
| Hillsboro | 359,297 | 348,400 | 199 | 26 | 1,730 | 14 | 12 | 51 | 2 | 1992 | 100,462 | 4,059 | 34 | 70,180 | 52.1 | 53.5 | 11.4 | 3.5 | 2.2 | 29.4 | 21.5 | 15 | 1,176 | 12.9 | 6.3 | 71.1 | 37.2 | 79.8 | 3.2 | 4.4 | 0.9 | 8.5 | 155 | 17 | 1613 | 0 | 1,613 | 79 | 64 | 165 | 3,391 | 315 | 37 | 1,268 | 7.8 | 26 | 6.7 | 1.6 | 2.4 | 4 | 1 | 8 | 9 | 87 | 3.4 | 45 |
| Lake Oswego | 738,306 | 627,500 | 284 | 41 | 839 | 20 | 10 | 40 | 2 | 1979 | 38,065 | 3,336 | 45 | 89,979 | 67.2 | 59 | 11.9 | 5.9 | 1.4 | 21.8 | 39.3 | 27.6 | 1,371 | 7.2 | 6.3 | 87.5 | 29.6 | 82 | 5 | 3.9 | 1.2 | 10.1 | 17 | 5 | 62 | 0 | 370 | 9 | 5 | 14 | 446 | 36 | 13 | 701 | 9.6 | 18 | 3.9 | 0.8 | 1.5 | 2.3 | 0 | 6 | 6 | 29 | 2.6 | 36 |
| Maywood Park | 411,070 | 403,400 | 153 | 35 | 20 | 0 | 14 | 52 | 5 | 1941 | 939 | 5,623 | 45 | 87,115 | 87.5 | 60.7 | 9.1 | 4 | 1.3 | 25 | 29.3 | 14.5 | 1,321 | 9.1 | 6.8 | 96.3 | 33.7 | 93.4 | 2.2 | 2.6 | 0.4 | 5.2 | – | – | – | – | – | – | – | – | – | – | – | 18 | 16.5 | 14 | 8.6 | 2.4 | 0.4 | 2.8 | 1 | 3 | 4 | 1 | 4.5 | 71 |
| McMinnville | 303,416 | 290,000 | 164 | 51 | 495 | 1 | 12 | 65 | 3 | 1986 | 33,724 | 3,200 | 35 | 47,460 | 57.8 | 50.1 | 12.8 | 7.3 | 1.7 | 28.1 | 13.3 | 8.8 | 864 | 19.8 | 10.3 | 79.4 | 34.3 | 81.9 | 5.4 | 3.2 | 0.6 | 9.2 | 31 | 2 | 90 | 0 | 687 | 15 | 10 | 50 | 827 | 58 | 26 | 305 | 4.5 | 55 | 0.6 | 1.6 | 7.7 | 9.3 | 0 | 9 | 9 | 17 | 1.6 | 41 |
| Milwaukie | 352,025 | 345,000 | 203 | 25 | 297 | 5 | 10 | 64 | 4 | 1960 | 20,643 | 4,074 | 42 | 55,880 | 59.5 | 41.2 | 17.6 | 6.9 | 1.5 | 32.7 | 19.1 | 10 | 972 | 12.1 | 7.2 | 90.1 | 24.2 | 83.6 | 7.5 | 2.3 | 0.4 | 10.2 | 13 | 3 | 48 | 0 | 311 | 5 | 11 | 86 | 445 | 32 | 23 | 132 | 4.1 | 14 | 6 | 1.7 | 1.7 | 3.4 | 1 | 10 | 11 | 11 | 2.1 | 48 |
| Newberg | 333,734 | 325,000 | 185 | 36 | 476 | 2 | 15 | 48 | 3 | 1990 | 22,749 | 3,921 | 33 | 53,075 | 62.2 | 44.4 | 12.6 | 4.3 | 0.7 | 38.1 | 19.5 | 8.8 | 943 | 19.1 | 6.6 | 88.2 | 32.1 | 79.4 | 8.6 | 3.6 | 0.5 | 12.7 | 12 | 1 | 64 | 0 | 355 | 16 | 5 | 24 | 443 | 34 | 21 | 386 | 10.3 | 35 | 0.9 | 3 | 6 | 9 | 0 | 2 | 2 | 10 | 28.7 | 72 |
| Oregon City | 376,900 | 379,900 | 189 | 36 | 708 | 1 | 9 | 52 | 3 | 1984 | 35,057 | 3,553 | 38 | 65,548 | 66.9 | 51.2 | 16 | 3.8 | 1.7 | 27.2 | 17.7 | 6.4 | 1,053 | 11 | 5.5 | 92.6 | 38.2 | 82.2 | 3.9 | 1.9 | 0.1 | 5.9 | 39 | 6 | 86 | 1 | 592 | 22 | 10 | 57 | 735 | 78 | 23 | 445 | 6.9 | 24 | 3.6 | 0.3 | 2.9 | 3.2 | 0 | 7 | 7 | 37 | 3.7 | 34 |
| Portland | 460,277 | 400,350 | 248 | 31 | 10,095 | 17 | 5 | 40 | 2 | 1958 | 620,589 | 4,278 | 37 | 58,423 | 53.1 | 40.9 | 12.6 | 4.2 | 1.8 | 40.5 | 28.1 | 18.8 | 1,025 | 16.9 | 7.5 | 81 | 25.2 | 79.8 | 3.2 | 4.5 | 1 | 8.7 | 1774 | 234 | 4,064 | 14 | 24,099 | 389 | 986 | 4,924 | 33,087 | 3,397 | 59 | 13,530 | 14.6 | 0 | 12.1 | 6.5 | 6 | 12.5 | 8 | 67 | 75 | 466 | 3.2 | 65 |
| Sauvie Island | 933,423 | 803,750 | 352 | 105 | 10 | 0 | 9 | 67 | 0 | 1975 | 2,543 | 81 | 52 | 77,208 | 82.4 | 57.8 | 15.9 | 4.9 | 1.2 | 20.1 | 29.6 | 14.9 | 1,865 | 5 | 4.4 | 96.5 | 36 | 86.7 | 7.2 | 1.9 | 0 | 9.1 | – | – | – | – | – | – | – | – | – | – | – | 12,657 | 60 | 35 | 3.7 | 0 | 0.8 | 0.8 | 0 | 1 | 1 | 9 | 0.1 | 3 |
| Scappoose | 317,832 | 318,250 | 164 | 30 | 208 | 0 | 23 | 58 | 4 | 1999 | 6,901 | 2,563 | 36 | 63,175 | 68.6 | 50.8 | 14.7 | 7.1 | 1.6 | 25.8 | 15.1 | 9.8 | 911 | 12.9 | 9.2 | 96.4 | 37.7 | 75.7 | 7 | 4.3 | 0 | 11.3 | 4 | 1 | 5 | 0 | 48 | 5 | 3 | 8 | 61 | 13 | 11 | 115 | 0.7 | 35 | 0 | 0 | 1.8 | 1.8 | 0 | 7 | 7 | 1 | 0.02 | 50 |
| Sherwood | 396,473 | 390,000 | 205 | 26 | 451 | 11 | 12 | 40 | 3 | 1998 | 18,965 | 4,374 | 37 | 86,111 | 75.1 | 62 | 10.7 | 4 | 1 | 22.4 | 31.2 | 14.9 | 1,333 | 4.7 | 4.8 | 89.2 | 47.6 | 86.1 | 4.1 | 2.6 | 0.2 | 6.9 | 6 | 3 | 20 | 0 | 185 | 6 | 1 | 15 | 220 | 16 | 12 | 273 | 9.5 | 22 | 3 | 0.5 | 1.6 | 2.1 | 0 | 3 | 3 | 20 | 4.5 | 34 |
| St. Helens | 252,452 | 263,950 | 154 | 33 | 282 | 0 | 15 | 70 | 8 | 1980 | 13,169 | 2,262 | 37 | 45,727 | 61.8 | 45.6 | 17.8 | 6.3 | 3.5 | 26.9 | 11.9 | 3 | 850 | 19 | 7.7 | 93.4 | 41 | 84.2 | 4.9 | 2.6 | 0 | 7.5 | 26 | 2 | 40 | 0 | 260 | 9 | 3 | 27 | 327 | 40 | 28 | 143 | 4 | 45 | 1.8 | 1 | 3.7 | 4.7 | 0 | 7 | 7 | 16 | 1.9 | 41 |
| Tigard | 425,422 | 415,349 | 203 | 31 | 1,112 | 8 | 9 | 48 | 1 | 1993 | 50,787 | 3,996 | 38 | 65,505 | 58.5 | 52 | 12.9 | 5.2 | 1.4 | 28.5 | 29.1 | 13.7 | 1,058 | 12.1 | 6.1 | 81.9 | 31.6 | 83 | 4.5 | 3.7 | 0.6 | 8.8 | 64 | 12 | 114 | 0 | 1,298 | 23 | 38 | 83 | 1,495 | 137 | 32 | 608 | 7.5 | 20 | 5.2 | 1 | 2.4 | 3.4 | 1 | 17 | 18 | 45 | 3.6 | 45 |
| Troutdale | 318,451 | 315,000 | 179 | 29 | 251 | 2 | 11 | 47 | 7 | 1989 | 16,535 | 2,745 | 34 | 62,992 | 61.5 | 50.7 | 14.2 | 2 | 1.3 | 31.8 | 20.2 | 5.2 | 1,014 | 15.2 | 11.6 | 83.1 | 38.2 | 84.6 | 1.6 | 2.6 | 1.4 | 5.6 | – | – | – | – | – | – | – | – | – | – | – | 450 | 11.7 | 16 | 3.8 | 0.2 | 2.4 | 2.6 | 0 | 4 | 4 | 19 | 3.1 | 62 |
| Tualatin | 425,629 | 426,000 | 203 | 28 | 369 | 15 | 11 | 43 | 2 | 1980 | 27,024 | 3,315 | 38 | 71,896 | 55.2 | 54 | 11.4 | 3.9 | 1.4 | 29.3 | 28.6 | 14.6 | 1,078 | 10.9 | 6.2 | 80.9 | 33.8 | 85.2 | 5.8 | 2.9 | 0.3 | 9 | 32 | 4 | 64 | 0 | 614 | 7 | 13 | 45 | 723 | 56 | 29 | 378 | 7.2 | 12 | 4.3 | 0.5 | 2 | 2.5 | 1 | 8 | 9 | 43 | 5.2 | 28 |
| Vancouver | 312,991 | 285,000 | 183 | 34 | 2,638 | 12 | 10 | 50 | 3 | 1981 | 169,982 | 3,398 | 37 | 52,004 | 49.2 | 46.3 | 15 | 5.6 | 2.5 | 30.6 | 17.3 | 9.4 | 986 | 13.5 | 8.1 | 80.1 | 30.9 | 78.9 | 1.8 | 5.6 | 0.6 | 8 | 410 | 50 | 860 | 0 | 3,666 | 117 | 148 | 1,007 | 5,533 | 725 | 37 | 1,568 | 0.5 | 26 | 3.4 | 0.4 | 2.8 | 7.5 | 0 | 21 | 21 | 105 | 1 | 41 |
| Washougal | 374,755 | 362,000 | 163 | 41 | 367 | 1 | 11 | 43 | 2 | 1989 | 14,987 | 2,403 | 37 | 70,943 | 70.4 | 55.8 | 10.6 | 5.2 | 1.1 | 27.3 | 17.6 | 7.4 | 962 | 9.1 | 7.3 | 92.6 | 40.9 | 86.1 | 0.3 | 4.7 | 0.2 | 5.2 | 22 | 1 | 38 | 0 | 141 | 6 | 1 | 20 | 199 | 30 | 15 | 103 | 12.8 | 24 | 1.7 | 0 | 2.6 | 2.6 | 0 | 1 | 1 | 3 | 11.9 | 50 |
| West Linn | 540,065 | 506,700 | 207 | 44 | 581 | 14 | 11 | 31 | 3 | 1988 | 26,242 | 3,243 | 43 | 89,806 | 76.7 | 61.2 | 10.1 | 3.7 | 0.9 | 24.1 | 33.7 | 21.9 | 1,315 | 4.8 | 5.6 | 89.9 | 36.3 | 86.2 | 2.7 | 2.8 | 0.9 | 6.4 | – | – | – | – | – | – | – | – | – | – | – | 628 | 12.1 | 24 | 2.8 | 0.4 | 1.4 | 1.8 | 0 | 2 | 2 | 25 | 3 | 29 |
| Wilsonville | 427,438 | 414,495 | 214 | 41 | 610 | 6 | 6 | 30 | 1 | 2004 | 21,814 | 2,874 | 36 | 63,097 | 43.6 | 50.5 | 15.2 | 4.2 | 2.4 | 27.7 | 26.5 | 15.4 | 1,127 | 10 | 6.8 | 84.5 | 30.8 | 72.4 | 12.6 | 5.5 | 0.1 | 18.2 | 13 | 3 | 46 | 0 | 303 | 5 | 4 | 31 | 380 | 25 | 19 | 435 | 8.9 | 20 | 2.6 | 1.4 | 2 | 3.4 | 1 | 8 | 9 | 32 | 4.2 | 24 |
| Wood Village | 263,523 | 240,000 | 163 | 26 | 51 | 31 | 9 | 111 | 0 | 1975 | 3,996 | 4,197 | 29 | 47,786 | 53.1 | 41.8 | 11.7 | 3.7 | 2 | 40.8 | 9.9 | 2.1 | 933 | 28.2 | 8.5 | 62.9 | 60.2 | 76.2 | 4.3 | 1.5 | 0 | 5.8 | – | – | – | – | – | – | – | – | – | – | – | 21 | 3.5 | 18 | 4.6 | 0 | 4.8 | 4.8 | 0 | 2 | 2 | 4 | 3.7 | 55 |
Methodology
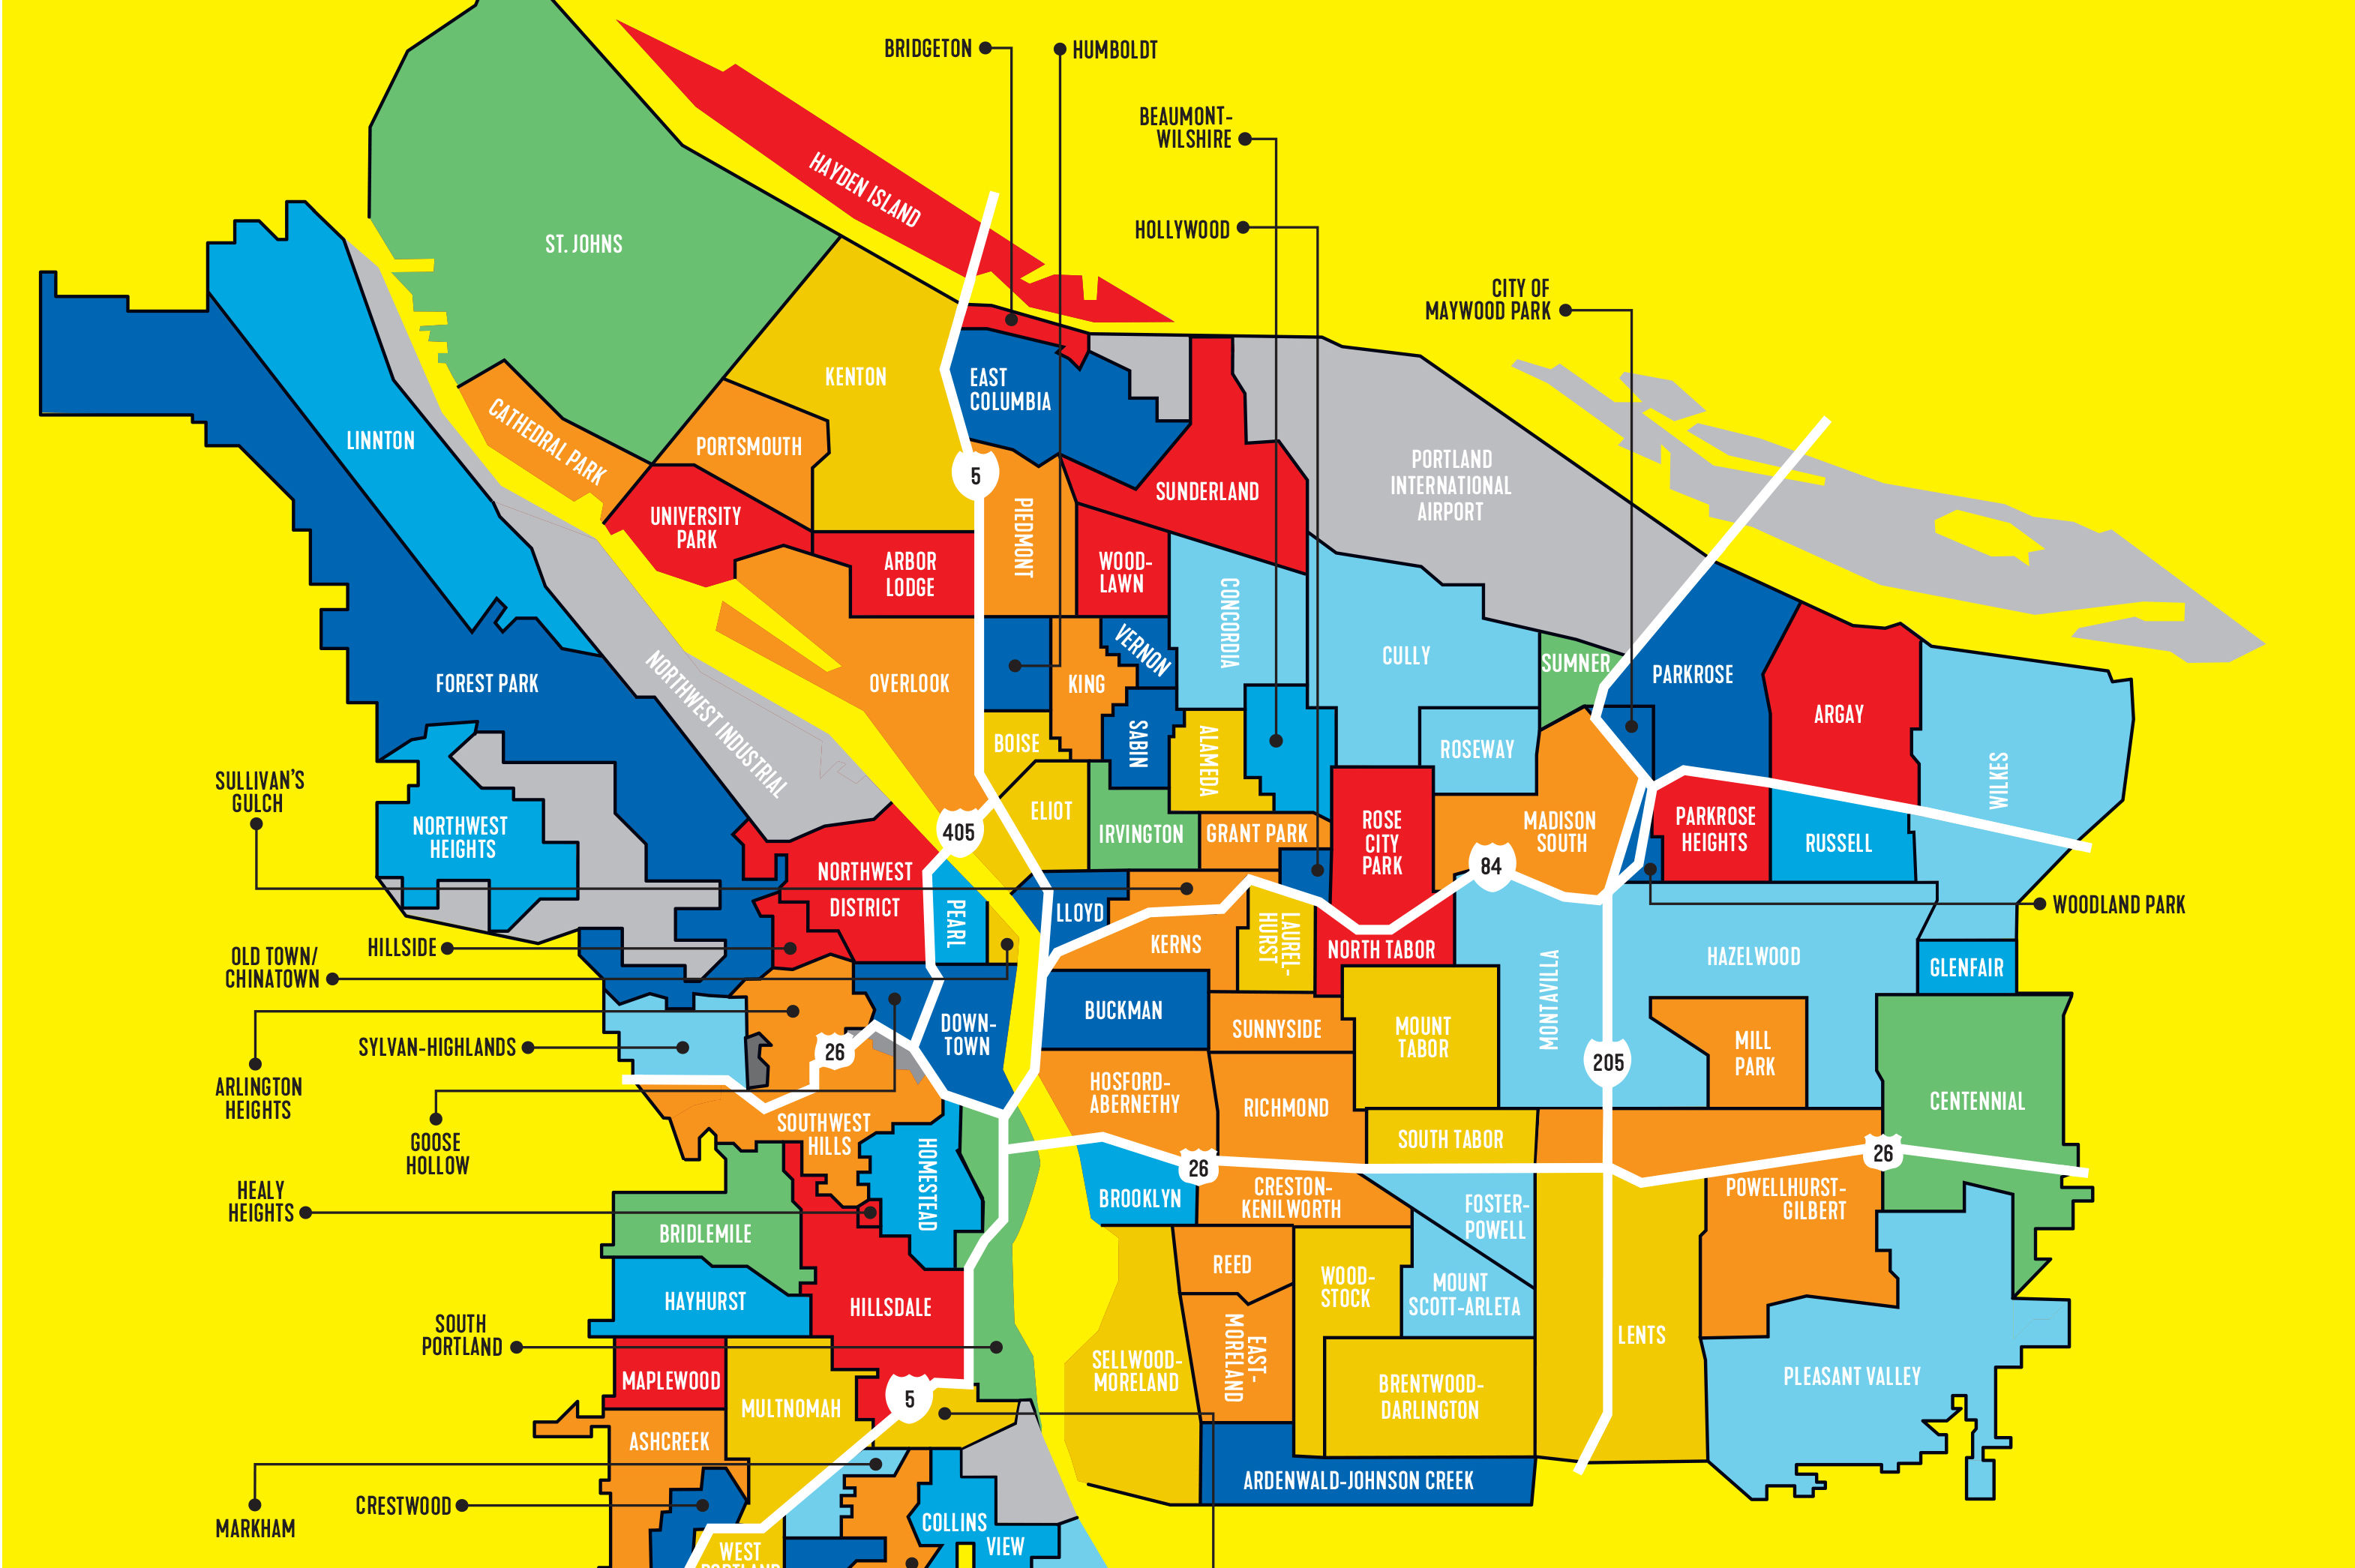
Neighborhoods
Boundaries represent records maintained by the city as of January 2018. Boundary conflicts were resolved for statistical purposes only. Due to overlap between certain neighborhoods, boundary definitions may vary occasionally across categories. With the exception of the area unofficially (but universally) known as Dunthorpe, unclaimed sections of Multnomah County were excluded.
Real Estate
2017 data from the Regional Multiple Listing Service with analysis by the Center for Spatial Analysis and Research at Portland State University’s Department of Geography. Figures were rounded for legibility.
People
Data from the US Census Bureau’s American Community Survey 5-Year Estimates, released December 2017. The ACS data are estimates only and accuracy varies by attribute.
Rent Costs
Calculated from all renter-occupied units, estimated median rent is not adjusted for unit size or number of occupants. Figure includes estimated monthly utility costs.
Median Income
The Census defines household as including “all the persons who occupy a housing unit as their usual place of residence.” Thus this estimate includes living situations ranging from individuals to large households.
Crime
Portland neighborhood crime data reflects 2017 data provided by the Portland Police Bureau. For cities, crime data reflects 2016 and was sourced from the FBI. As of press time, 2016 crime data was not available for the cities of Maywood Park, Troutdale, West Linn, Wood Village, and unincorporated Sauvie Island. Nonviolent crime includes burglary, larceny (theft), and vehicle theft. Violent crime is defined as aggravated assault, arson, homicide, rape, and robbery. Crimes per 1,000 figures are based on reported incidents of both nonviolent and violent crime. Many factors can influence the crimes-per-1,000 figure and can sometimes complicate meaningful neighborhood comparisons (e.g., commercial districts, or neighborhoods with high traffic and low population density).
Parks
Data from Metro (2017 or most recently available) and/or individual cities.
Transit
Portland 2017 data from TriMet. Suburban transit information was sourced from TriMet as well as other services, including CC Rider, C-TRAN, Canby Area Transit, Yamhill County Transit Area, and South Metro Area Regional Transit.
Minutes by Car to Downtown
Google Maps estimate, based on non–rush hour conditions, from a neighborhood/suburb central point to Pioneer Courthouse Square.
Walk Score
2017 data from Walkscore.com. This score reflects, on a scale of 1 to 100, a neighborhood’s pedestrian-friendliness based on distances to amenities such as grocery stores and other routine destinations.
Unavailable Data
Unavailable data is noted with a dash (—).
Special thanks to David Banis, Colin Finnegan, and Andrew Nelson of PSU’s Center for Spatial Analysis and Research. Research assistance from Sarah Hutchins.